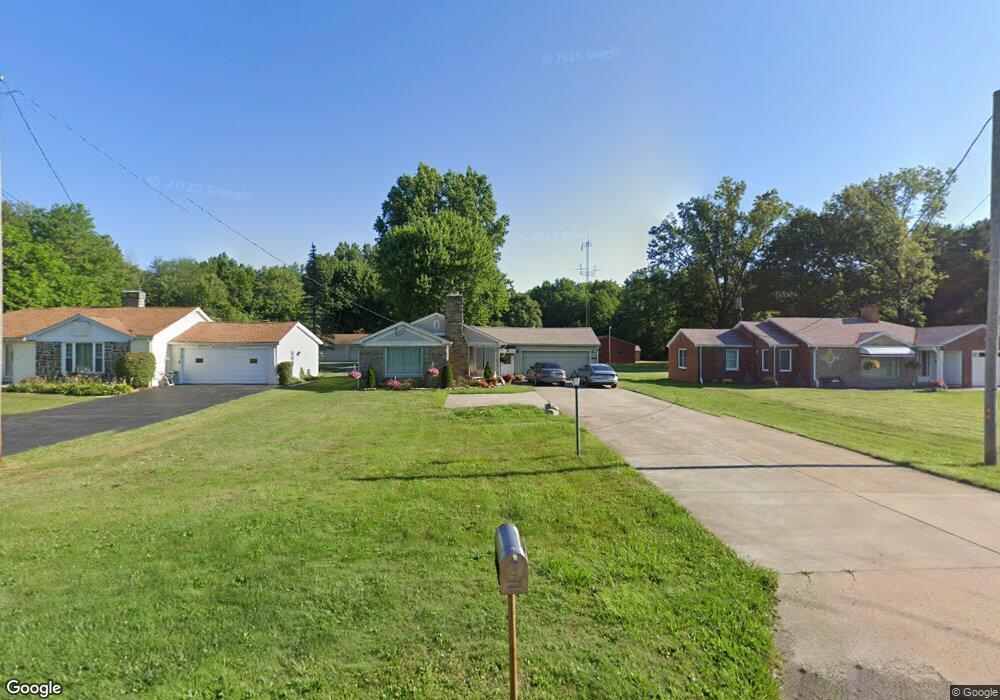
5628 Shields Rd Canfield, OH 44406
Estimated Value: $161,000 - $214,000
3
Beds
2
Baths
1,001
Sq Ft
$187/Sq Ft
Est. Value
About This Home
This home is located at 5628 Shields Rd, Canfield, OH 44406 and is currently estimated at $187,031, approximately $186 per square foot. 5628 Shields Rd is a home located in Mahoning County with nearby schools including Canfield Village Middle School and Canfield High School.
Ownership History
Date
Name
Owned For
Owner Type
Purchase Details
Closed on
Feb 8, 2023
Bought by
Angiuli Mario
Current Estimated Value
Purchase Details
Closed on
Nov 29, 2022
Sold by
Jacobson Brianna Beth
Bought by
Angiuli Mario
Purchase Details
Closed on
Jul 9, 2019
Bought by
Jacobson Brianna Beth
Home Financials for this Owner
Home Financials are based on the most recent Mortgage that was taken out on this home.
Interest Rate
3.75%
Purchase Details
Closed on
Jan 30, 1998
Sold by
Cina John T and Cina Megan R
Bought by
Zarlenga Frank J
Purchase Details
Closed on
Nov 7, 1995
Sold by
Laciuita Lawrence M
Bought by
Cina John T and Cina Megan R
Home Financials for this Owner
Home Financials are based on the most recent Mortgage that was taken out on this home.
Original Mortgage
$89,000
Interest Rate
7.61%
Mortgage Type
New Conventional
Purchase Details
Closed on
Jun 1, 1987
Bought by
Lacivita L A and L A
Create a Home Valuation Report for This Property
The Home Valuation Report is an in-depth analysis detailing your home's value as well as a comparison with similar homes in the area
Home Values in the Area
Average Home Value in this Area
Purchase History
| Date | Buyer | Sale Price | Title Company |
|---|---|---|---|
| Angiuli Mario | $120,000 | -- | |
| Angiuli Mario | $120,000 | None Listed On Document | |
| Angiuli Mario | $120,000 | None Listed On Document | |
| Jacobson Brianna Beth | $85,000 | -- | |
| Zarlenga Frank J | $109,000 | -- | |
| Cina John T | $98,900 | -- | |
| Lacivita L A | $48,000 | -- |
Source: Public Records
Mortgage History
| Date | Status | Borrower | Loan Amount |
|---|---|---|---|
| Previous Owner | Jacobson Brianna Beth | -- | |
| Previous Owner | Cina John T | $89,000 | |
| Closed | Zarlenga Frank J | $0 |
Source: Public Records
Tax History
| Year | Tax Paid | Tax Assessment Tax Assessment Total Assessment is a certain percentage of the fair market value that is determined by local assessors to be the total taxable value of land and additions on the property. | Land | Improvement |
|---|---|---|---|---|
| 2025 | $1,998 | $48,420 | $7,390 | $41,030 |
| 2024 | $1,999 | $48,420 | $7,390 | $41,030 |
| 2023 | $2,009 | $48,420 | $7,390 | $41,030 |
| 2022 | $1,906 | $36,670 | $7,390 | $29,280 |
| 2021 | $1,848 | $36,670 | $7,390 | $29,280 |
| 2020 | $1,856 | $36,670 | $7,390 | $29,280 |
| 2019 | $1,363 | $32,850 | $7,390 | $25,460 |
| 2018 | $1,271 | $32,850 | $7,390 | $25,460 |
| 2017 | $1,268 | $32,850 | $7,390 | $25,460 |
| 2016 | $1,267 | $31,680 | $6,380 | $25,300 |
| 2015 | $1,239 | $31,680 | $6,380 | $25,300 |
| 2014 | $1,244 | $31,680 | $6,380 | $25,300 |
| 2013 | $1,199 | $31,680 | $6,380 | $25,300 |
Source: Public Records
Map
Nearby Homes
- 52 Lakhani Ln
- 10 Villa Theresa Ln
- 20 Villa Theresa Ln
- 30 Villa Theresa Ln
- 0 Shields Rd Unit 5162190
- 21 Villa Theresa Ln
- 31 Villa Theresa Ln
- 41 Villa Theresa Ln
- 9 Willow Way
- 80 Villa Theresa Ln
- 51 Villa Theresa Ln
- 90 Villa Theresa Ln
- 61 Villa Theresa Ln
- 71 Villa Theresa Ln
- 81 Villa Theresa Ln
- 91 Villa Theresa Ln
- 68 Timber Run Dr
- 492 Hickory Hollow Dr
- 21 Timber Run Ct
- 36 Hilltop Blvd
- 5642 Shields Rd
- 5612 Shields Rd
- 5656 Shields Rd
- 5588 Shields Rd
- 5572 Shields Rd
- 5672 Shields Rd
- 130 Curtis Ave
- 5538 Shields Rd
- 5710 Shields Rd
- 5705 Curtis Ave
- 5567 U S Highway 62
- 5561 Shields Rd
- 5516 Shields Rd
- 70 Curtis Ave
- 5668 Curtis Ave
- 5498 Shields Rd
- 5711 Shields Rd
- 50 Curtis Ave
- 100 Curtis Ave
- 5165 S Canfield Niles Rd
Your Personal Tour Guide
Ask me questions while you tour the home.