563 2nd St E Sonoma, CA 95476
Estimated Value: $3,894,000 - $7,215,542
3
Beds
3
Baths
2,440
Sq Ft
$2,247/Sq Ft
Est. Value
About This Home
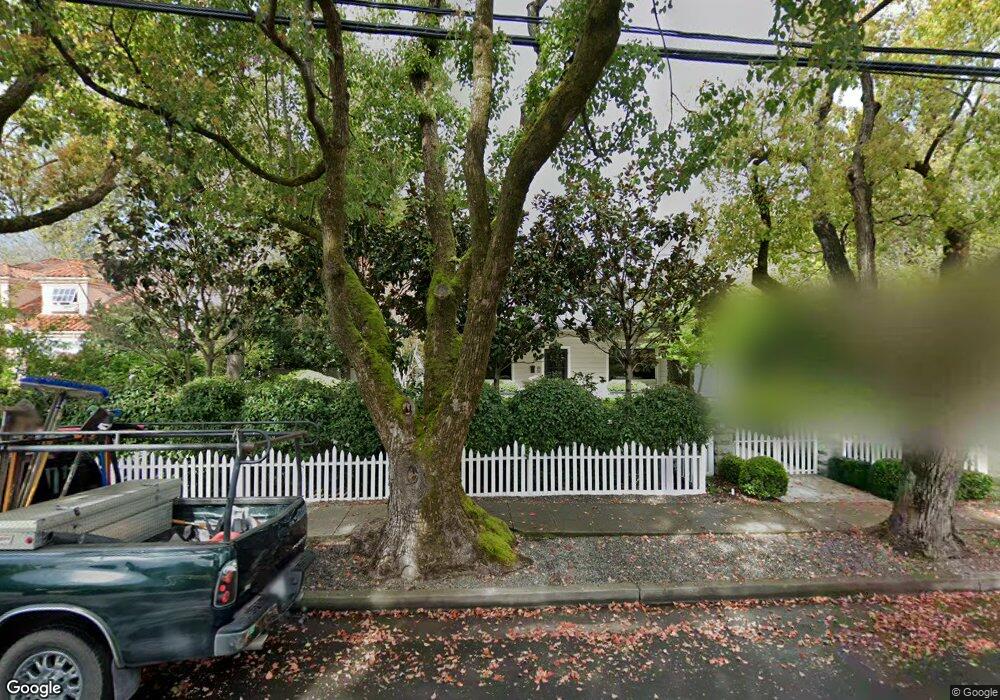
This home is located at 563 2nd St E, Sonoma, CA 95476 and is currently estimated at $5,482,847, approximately $2,247 per square foot. 563 2nd St E is a home located in Sonoma County with nearby schools including Prestwood Elementary School, Adele Harrison Middle School, and Creekside High School.
Ownership History
Date
Name
Owned For
Owner Type
Purchase Details
Closed on
Feb 8, 2013
Sold by
Hughes Keith W and Hughes Cheryl F
Bought by
Hughes Keith W and Hughes Cheryl F
Current Estimated Value
Purchase Details
Closed on
Feb 3, 2010
Sold by
Peschon John and Peschon Adrienne
Bought by
Hughes Keith W and Hughes Cheryl F
Purchase Details
Closed on
Apr 8, 2008
Sold by
Peschon John and Peschon Adrienne
Bought by
Peschon John and Peschon Adrienne
Purchase Details
Closed on
Jul 29, 1993
Sold by
Knorre Frederick J and Knorre Evelyn J
Bought by
Peschon John and Peschon Adrienne
Home Financials for this Owner
Home Financials are based on the most recent Mortgage that was taken out on this home.
Original Mortgage
$304,500
Interest Rate
5.99%
Create a Home Valuation Report for This Property
The Home Valuation Report is an in-depth analysis detailing your home's value as well as a comparison with similar homes in the area
Home Values in the Area
Average Home Value in this Area
Purchase History
| Date | Buyer | Sale Price | Title Company |
|---|---|---|---|
| Hughes Keith W | -- | None Available | |
| Hughes Keith W | $1,795,000 | Fidelity National Title Co | |
| Peschon John | -- | None Available | |
| Peschon John | $144,000 | Northwestern Title Security | |
| Peschon John | $291,000 | Northwestern Title Security |
Source: Public Records
Mortgage History
| Date | Status | Borrower | Loan Amount |
|---|---|---|---|
| Previous Owner | Peschon John | $304,500 |
Source: Public Records
Tax History
| Year | Tax Paid | Tax Assessment Tax Assessment Total Assessment is a certain percentage of the fair market value that is determined by local assessors to be the total taxable value of land and additions on the property. | Land | Improvement |
|---|---|---|---|---|
| 2025 | $56,694 | $5,021,591 | $1,431,918 | $3,589,673 |
| 2024 | $56,694 | $4,923,130 | $1,403,842 | $3,519,288 |
| 2023 | $56,694 | $4,826,599 | $1,376,316 | $3,450,283 |
| 2022 | $54,923 | $4,731,961 | $1,349,330 | $3,382,631 |
| 2021 | $53,982 | $4,639,178 | $1,322,873 | $3,316,305 |
| 2020 | $53,858 | $4,591,610 | $1,309,309 | $3,282,301 |
| 2019 | $52,696 | $4,501,580 | $1,283,637 | $3,217,943 |
| 2018 | $52,037 | $4,413,315 | $1,258,468 | $3,154,847 |
| 2017 | $63,979 | $5,331,781 | $1,233,793 | $4,097,988 |
| 2016 | $23,228 | $1,957,280 | $1,199,448 | $757,832 |
| 2015 | $22,193 | $1,927,881 | $1,181,432 | $746,449 |
| 2014 | $21,908 | $1,890,118 | $1,158,290 | $731,828 |
Source: Public Records
Map
Nearby Homes
Your Personal Tour Guide
Ask me questions while you tour the home.