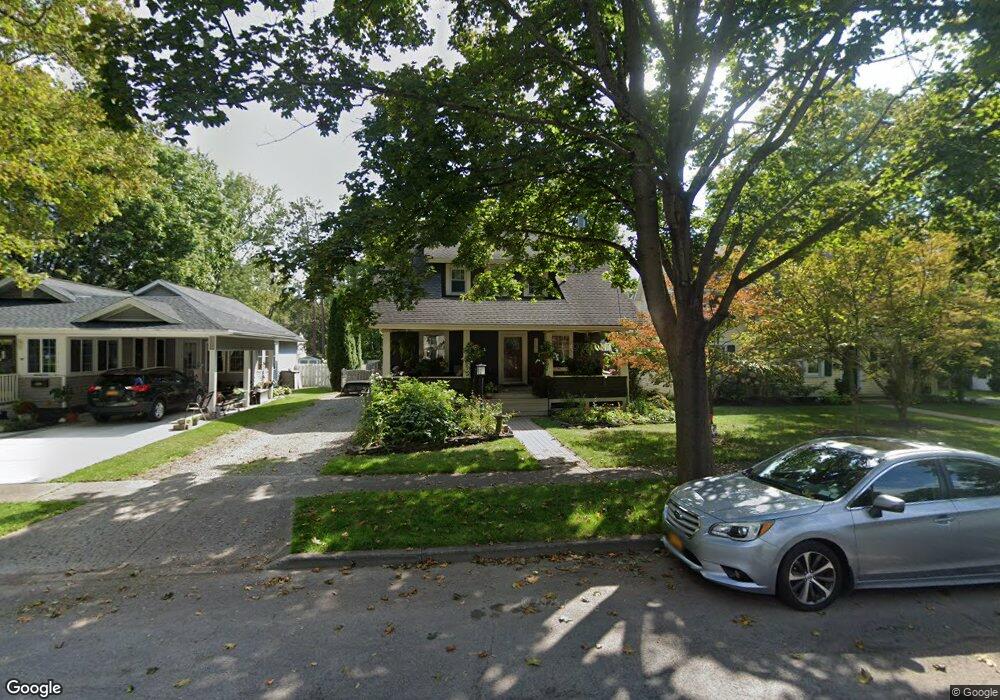
563 Crescent Ave East Aurora, NY 14052
Estimated Value: $334,117 - $410,000
3
Beds
1
Bath
1,232
Sq Ft
$294/Sq Ft
Est. Value
About This Home
This home is located at 563 Crescent Ave, East Aurora, NY 14052 and is currently estimated at $362,029, approximately $293 per square foot. 563 Crescent Ave is a home located in Erie County with nearby schools including Parkdale Elementary School, East Aurora Middle School, and East Aurora High School.
Ownership History
Date
Name
Owned For
Owner Type
Purchase Details
Closed on
Aug 6, 2015
Sold by
Roller Christopher P
Bought by
Balzano Matthew J and Dolce Maria A
Current Estimated Value
Home Financials for this Owner
Home Financials are based on the most recent Mortgage that was taken out on this home.
Original Mortgage
$156,000
Outstanding Balance
$122,860
Interest Rate
4.07%
Mortgage Type
New Conventional
Estimated Equity
$239,169
Purchase Details
Closed on
Jun 30, 2008
Sold by
Kvandal Kurt K and Kvandal Mary M
Bought by
Roller Christopher P
Home Financials for this Owner
Home Financials are based on the most recent Mortgage that was taken out on this home.
Original Mortgage
$102,500
Interest Rate
5.83%
Mortgage Type
Seller Take Back
Purchase Details
Closed on
Feb 17, 1999
Sold by
Bailey William H and Bailey Grace A
Bought by
Kvandal Kurt K and Kvandal Mary M
Create a Home Valuation Report for This Property
The Home Valuation Report is an in-depth analysis detailing your home's value as well as a comparison with similar homes in the area
Home Values in the Area
Average Home Value in this Area
Purchase History
| Date | Buyer | Sale Price | Title Company |
|---|---|---|---|
| Balzano Matthew J | $195,000 | None Available | |
| Roller Christopher P | $122,500 | None Available | |
| Kvandal Kurt K | $87,000 | -- |
Source: Public Records
Mortgage History
| Date | Status | Borrower | Loan Amount |
|---|---|---|---|
| Open | Balzano Matthew J | $156,000 | |
| Previous Owner | Roller Christopher P | $102,500 |
Source: Public Records
Tax History Compared to Growth
Tax History
| Year | Tax Paid | Tax Assessment Tax Assessment Total Assessment is a certain percentage of the fair market value that is determined by local assessors to be the total taxable value of land and additions on the property. | Land | Improvement |
|---|---|---|---|---|
| 2024 | -- | $56,700 | $4,800 | $51,900 |
| 2023 | $5,514 | $56,700 | $4,800 | $51,900 |
| 2022 | $5,459 | $56,700 | $4,800 | $51,900 |
| 2021 | $4,227 | $56,700 | $4,800 | $51,900 |
| 2020 | $4,718 | $56,700 | $4,800 | $51,900 |
| 2019 | $4,587 | $56,700 | $4,800 | $51,900 |
| 2018 | $4,860 | $56,700 | $4,800 | $51,900 |
| 2017 | $1,451 | $56,700 | $4,800 | $51,900 |
| 2016 | $4,464 | $56,700 | $4,800 | $51,900 |
| 2015 | -- | $56,700 | $4,800 | $51,900 |
| 2014 | -- | $56,700 | $4,800 | $51,900 |
Source: Public Records
Map
Nearby Homes
- 245 Sycamore St
- VL South St
- 555 South St
- 584 Oakwood Ave
- 57 Savage Place
- 1823 Center St
- 174 Blake Hill Rd
- 842 Oakwood Ave
- 529 Ridge Ave
- 72 Elmwood Ave
- 132 Beech Rd
- 35 Hamlin Ave
- 831 Lawrence Ave
- 116 Hamlin Ave
- 1005 Big Tree Rd
- 16 Aurora Mills Dr
- 585 Mill Rd
- 11 Beechwood Dr
- 216 Roycroft Cir
- 2131 Lapham Rd
- 567 Crescent Ave
- 559 Crescent Ave
- 579 Crescent Ave
- 553 Crescent Ave
- 261 Gleed Ave
- 260 Sycamore St
- 244 Sycamore St
- 564 Crescent Ave
- 265 Gleed Ave
- 238 Sycamore St
- 266 Sycamore St
- 273 Gleed Ave
- 576 Crescent Ave
- 570 Crescent Ave
- 226 Sycamore St
- 274 Sycamore St
- 589 Crescent Ave
- 246 Gleed Ave
- 580 Crescent Ave
- 279 Gleed Ave