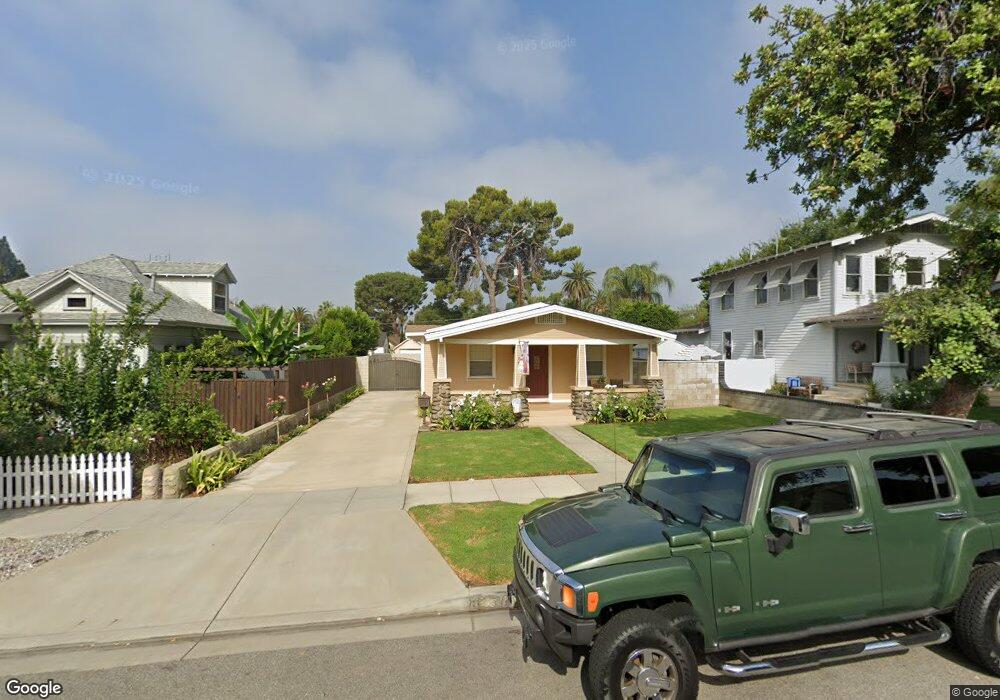
563 N 2nd Ave Upland, CA 91786
Estimated Value: $604,812 - $717,000
2
Beds
1
Bath
980
Sq Ft
$680/Sq Ft
Est. Value
About This Home
This home is located at 563 N 2nd Ave, Upland, CA 91786 and is currently estimated at $665,953, approximately $679 per square foot. 563 N 2nd Ave is a home located in San Bernardino County with nearby schools including Upland Elementary School, Upland Junior High School, and Upland High School.
Ownership History
Date
Name
Owned For
Owner Type
Purchase Details
Closed on
Apr 15, 2019
Sold by
Case Laura D
Bought by
Case Living Trust
Current Estimated Value
Purchase Details
Closed on
Feb 24, 2011
Sold by
Case Robert A
Bought by
Case Laura D
Create a Home Valuation Report for This Property
The Home Valuation Report is an in-depth analysis detailing your home's value as well as a comparison with similar homes in the area
Home Values in the Area
Average Home Value in this Area
Purchase History
| Date | Buyer | Sale Price | Title Company |
|---|---|---|---|
| Case Living Trust | -- | None Available | |
| Case Laura D | -- | None Available |
Source: Public Records
Tax History
| Year | Tax Paid | Tax Assessment Tax Assessment Total Assessment is a certain percentage of the fair market value that is determined by local assessors to be the total taxable value of land and additions on the property. | Land | Improvement |
|---|---|---|---|---|
| 2025 | $2,598 | $229,884 | $79,576 | $150,308 |
| 2024 | $2,515 | $225,377 | $78,016 | $147,361 |
| 2023 | $2,474 | $220,958 | $76,486 | $144,472 |
| 2022 | $2,418 | $216,625 | $74,986 | $141,639 |
| 2021 | $2,411 | $212,378 | $73,516 | $138,862 |
| 2020 | $2,345 | $210,200 | $72,762 | $137,438 |
| 2019 | $2,336 | $206,078 | $71,335 | $134,743 |
| 2018 | $2,280 | $202,037 | $69,936 | $132,101 |
| 2017 | $2,214 | $198,076 | $68,565 | $129,511 |
| 2016 | $2,027 | $194,193 | $67,221 | $126,972 |
| 2015 | $1,980 | $191,276 | $66,211 | $125,065 |
| 2014 | $1,928 | $187,529 | $64,914 | $122,615 |
Source: Public Records
Map
Nearby Homes
- 509 N Euclid Ave
- 636 N Palm Ave
- 511 D St
- 161 N 1st Ave
- 145 N 1st Ave
- 556 D St
- 111 N 1st Ave
- 107 N 1st Ave
- 855 N Palm Ave
- 922 N 4th Ave
- 435 W 9th St Unit B3
- 494 N Campus Ave
- 478 N Campus Ave
- 910 N Redding Way Unit I
- 910 N Redding Way Unit F
- 345 Euclid Place
- 144 Dorsett Ave
- 595 Orlando Ct
- 196 Eureka Place
- 580 Katy Dr
Your Personal Tour Guide
Ask me questions while you tour the home.