563 N Shore Rd Spofford, NH 03462
Estimated payment $2,090/month
Highlights
- Wood Flooring
- Corner Lot
- Natural Light
- New Englander Architecture
- 1 Car Detached Garage
- Soaking Tub
About This Home
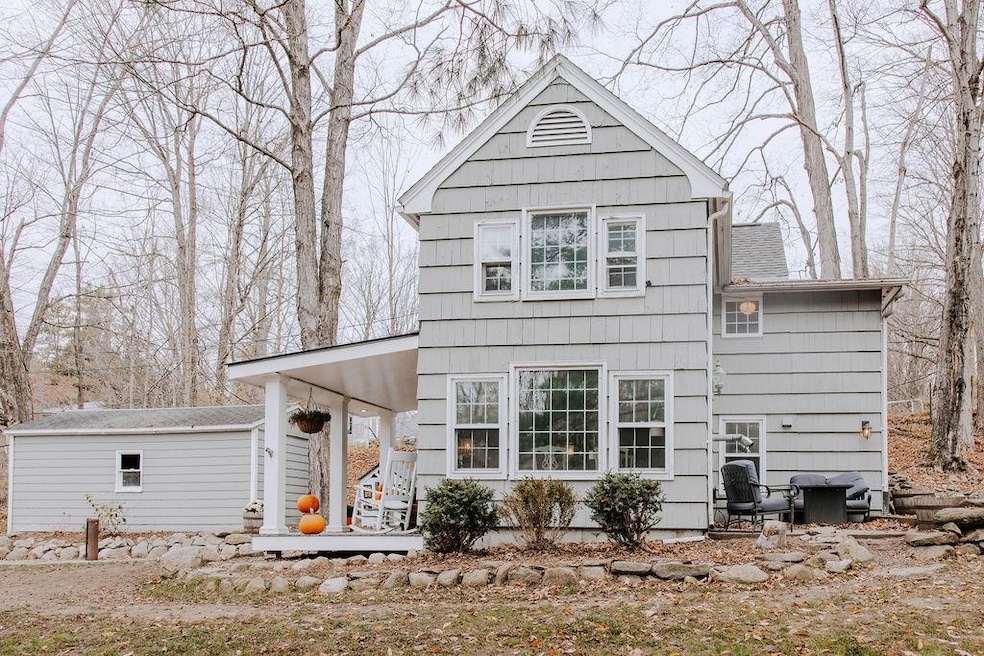
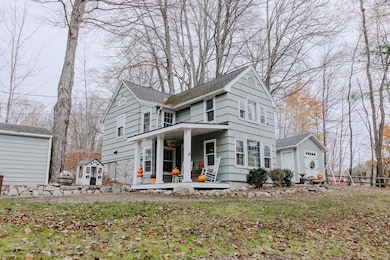
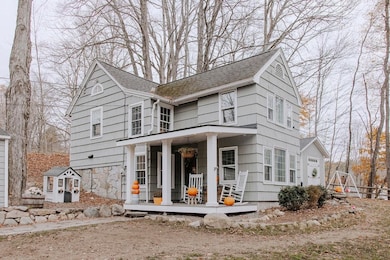
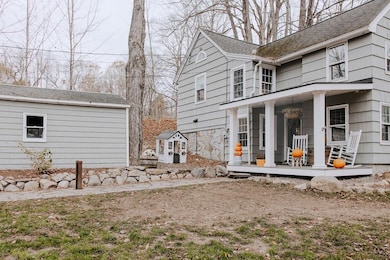
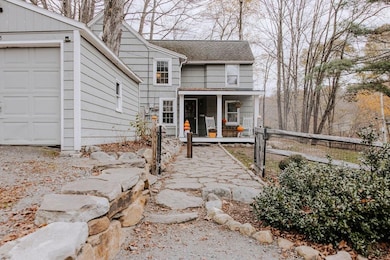
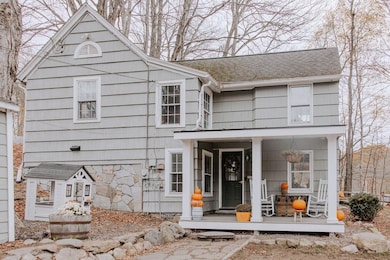
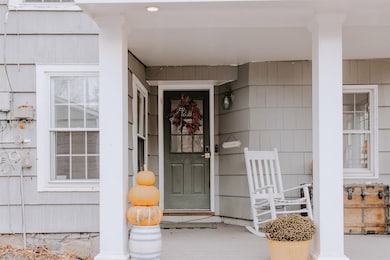
Step into a home where historic charm meets modern convenience. Nestled in the sought-after village of Spofford, this property captures the essence of small-town New Hampshire living with close proximity to all major amenities, hiking trails, and beautiful Spofford Lake. Built in 1920, this home showcases classic New England details and a warm, inviting atmosphere throughout. Large windows fill the home with abundant natural light, highlighting the character and craftsmanship in every room. Upstairs, an oversized soaking tub provides a peaceful retreat — the perfect place to unwind after a long day. Outside, enjoy a fenced yard and patio ideal for entertaining, while the front porch invites you to sit back and relax. Showings begin at the open house on Sunday, November 2, 2025, from 10:00 AM to 12:00 PM.

Home Details
Home Type
- Single Family
Est. Annual Taxes
- $2,945
Year Built
- Built in 1920
Lot Details
- 0.27 Acre Lot
- Property fronts a private road
- Corner Lot
- Property is zoned VILLAG
Parking
- 1 Car Detached Garage
- Gravel Driveway
- Dirt Driveway
Home Design
- New Englander Architecture
- Concrete Foundation
- Wood Frame Construction
- Wood Siding
Interior Spaces
- 1,314 Sq Ft Home
- Property has 2 Levels
- Ceiling Fan
- Natural Light
- Blinds
- Living Room
- Dining Room
- Dishwasher
Flooring
- Wood
- Carpet
- Laminate
- Slate Flooring
Bedrooms and Bathrooms
- 2 Bedrooms
- Soaking Tub
Laundry
- Dryer
- Washer
Outdoor Features
- Patio
- Outbuilding
Schools
- Chesterfield Elementary And Middle School
- Keene High School
Utilities
- Baseboard Heating
- Private Water Source
- Drilled Well
- Phone Available
- Satellite Dish
Listing and Financial Details
- Legal Lot and Block 6 / C
- Assessor Parcel Number 6A
Map
Home Values in the Area
Average Home Value in this Area
Tax History
| Year | Tax Paid | Tax Assessment Tax Assessment Total Assessment is a certain percentage of the fair market value that is determined by local assessors to be the total taxable value of land and additions on the property. | Land | Improvement |
|---|---|---|---|---|
| 2024 | $2,945 | $145,500 | $44,500 | $101,000 |
| 2023 | $2,884 | $145,500 | $44,500 | $101,000 |
| 2022 | $2,637 | $135,800 | $44,500 | $91,300 |
| 2021 | $2,582 | $135,800 | $44,500 | $91,300 |
| 2020 | $2,824 | $124,900 | $44,500 | $80,400 |
| 2019 | $2,690 | $120,500 | $44,500 | $76,000 |
| 2018 | $2,429 | $120,500 | $44,500 | $76,000 |
| 2016 | $2,566 | $120,700 | $44,500 | $76,200 |
| 2014 | $2,681 | $120,700 | $44,500 | $76,200 |
Property History
| Date | Event | Price | List to Sale | Price per Sq Ft |
|---|---|---|---|---|
| 10/30/2025 10/30/25 | For Sale | $350,000 | -- | $266 / Sq Ft |
Purchase History
| Date | Type | Sale Price | Title Company |
|---|---|---|---|
| Warranty Deed | $285,000 | None Available | |
| Warranty Deed | $285,000 | None Available | |
| Warranty Deed | $285,000 | None Available | |
| Quit Claim Deed | -- | -- | |
| Quit Claim Deed | -- | -- | |
| Quit Claim Deed | -- | -- | |
| Warranty Deed | $68,000 | -- | |
| Warranty Deed | $68,000 | -- |
Mortgage History
| Date | Status | Loan Amount | Loan Type |
|---|---|---|---|
| Open | $270,750 | Purchase Money Mortgage | |
| Closed | $270,750 | Purchase Money Mortgage | |
| Previous Owner | $130,000 | New Conventional | |
| Previous Owner | $120,000 | Unknown | |
| Previous Owner | $68,000 | Purchase Money Mortgage |
Source: PrimeMLS
MLS Number: 5067984
APN: CHFD-000006A-000000-C000006
Disclaimer: Certain information contained herein is derived from information provided by parties other than Homes.com. All information provided is deemed reliable, but is not guaranteed to be accurate and should be independently verified.
![]() Copyright 2025 PrimeMLS, Inc. All rights reserved. This information is deemed reliable, but not guaranteed. The data relating to real estate displayed on this display comes in part from the IDX Program of PrimeMLS. The information being provided is for consumers’ personal, non-commercial use and may not be used for any purpose other than to identify prospective properties consumers may be interested in purchasing.
Copyright 2025 PrimeMLS, Inc. All rights reserved. This information is deemed reliable, but not guaranteed. The data relating to real estate displayed on this display comes in part from the IDX Program of PrimeMLS. The information being provided is for consumers’ personal, non-commercial use and may not be used for any purpose other than to identify prospective properties consumers may be interested in purchasing.
- 36 Canal St
- 43 Westmoreland Rd
- 21 Valley Park Dr
- 349 Old Chesterfield Rd
- 85 Foley Rd
- 123 Poocham Rd
- 821 Route 9
- 0 Stow Dr Unit 4929741
- 00 Orchard Rd Unit 1
- 61 Orchard Rd
- 28 Owens Dr Unit 92
- 28 Owens Dr Unit 94
- 126 Pondview Rd
- 121 Pondview Rd
- 68 Brookview Rd
- 15 Stearns Rd
- 000 S Village Rd Unit 13
- 168 Arch St
- 136 Cross Rd
- 626 W Swanzey Rd
- 12 Lake Dr
- 12 Bennett Rd
- 477 Route 63
- 742 W Swanzey Rd
- 3 N Winchester St Unit C
- 3 N Winchester St Unit B
- 3 N Winchester St Unit A
- 907 W Swanzey Rd
- 35 Hastings Ave
- 127 Holbrook Ave Unit 1
- 56 London Rd
- 56 London Rd Unit Sunny Westmoreland Oasis
- 311-323 Maple Ave
- 1155 Putney Rd Unit 1A
- 216 West St Unit A502
- 222 West St Unit A203
- 222 West St
- 130 Martell Ct Unit 1
- 57 Winchester St
- 368 Court St Unit 2