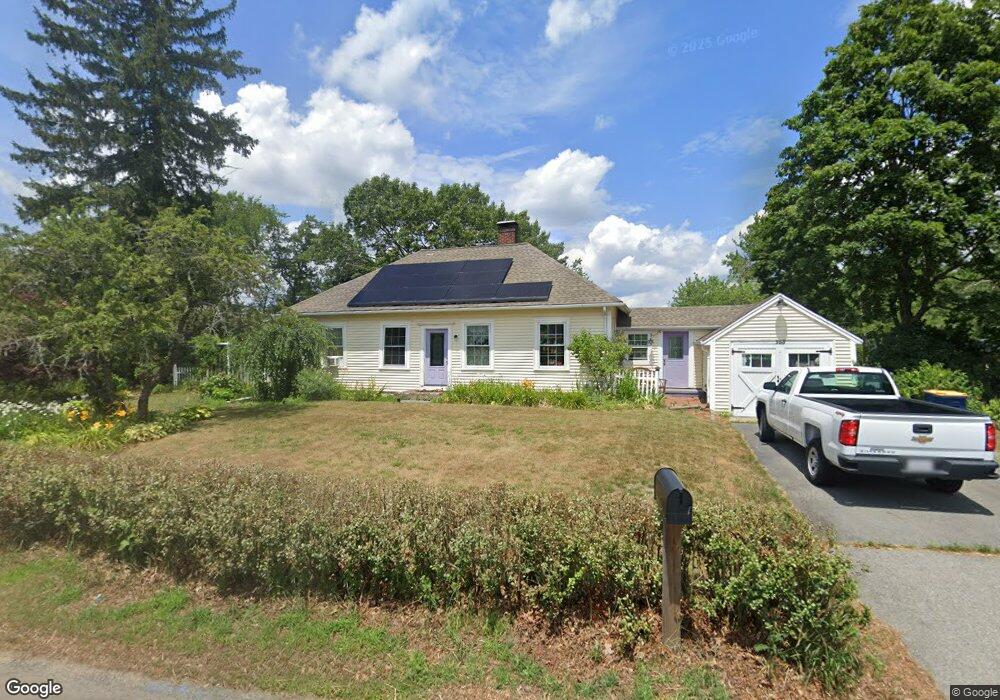
563 S Main St Sharon, MA 02067
Estimated Value: $574,844 - $700,000
2
Beds
1
Bath
960
Sq Ft
$636/Sq Ft
Est. Value
About This Home
This home is located at 563 S Main St, Sharon, MA 02067 and is currently estimated at $610,961, approximately $636 per square foot. 563 S Main St is a home located in Norfolk County with nearby schools including Heights Elementary School, Sharon Middle School, and Sharon High School.
Ownership History
Date
Name
Owned For
Owner Type
Purchase Details
Closed on
Feb 19, 2003
Sold by
M H Rt and Clymer Jhn H
Bought by
Hoyt Vickie A
Current Estimated Value
Home Financials for this Owner
Home Financials are based on the most recent Mortgage that was taken out on this home.
Original Mortgage
$249,000
Outstanding Balance
$106,874
Interest Rate
5.98%
Mortgage Type
Purchase Money Mortgage
Estimated Equity
$504,087
Create a Home Valuation Report for This Property
The Home Valuation Report is an in-depth analysis detailing your home's value as well as a comparison with similar homes in the area
Home Values in the Area
Average Home Value in this Area
Purchase History
| Date | Buyer | Sale Price | Title Company |
|---|---|---|---|
| Hoyt Vickie A | $263,000 | -- |
Source: Public Records
Mortgage History
| Date | Status | Borrower | Loan Amount |
|---|---|---|---|
| Open | Hoyt Vickie A | $249,000 |
Source: Public Records
Tax History
| Year | Tax Paid | Tax Assessment Tax Assessment Total Assessment is a certain percentage of the fair market value that is determined by local assessors to be the total taxable value of land and additions on the property. | Land | Improvement |
|---|---|---|---|---|
| 2025 | $9,738 | $557,100 | $447,900 | $109,200 |
| 2024 | $9,143 | $520,100 | $410,900 | $109,200 |
| 2023 | $9,475 | $509,700 | $384,200 | $125,500 |
| 2022 | $8,694 | $440,200 | $320,100 | $120,100 |
| 2021 | $8,423 | $412,300 | $302,000 | $110,300 |
| 2020 | $7,834 | $412,300 | $302,000 | $110,300 |
| 2019 | $7,331 | $377,700 | $267,400 | $110,300 |
| 2018 | $7,211 | $372,300 | $262,000 | $110,300 |
| 2017 | $6,971 | $355,300 | $245,000 | $110,300 |
| 2016 | $6,948 | $345,500 | $245,000 | $100,500 |
| 2015 | $6,443 | $317,400 | $225,000 | $92,400 |
| 2014 | $5,951 | $289,600 | $204,500 | $85,100 |
Source: Public Records
Map
Nearby Homes
- 483 S Main St
- 668 S Main St
- 2 Foxfire Dr
- 180 Old Post Rd Unit 202
- 180 Old Post Rd Unit 206
- 180 Old Post Rd Unit 308
- 180 Old Post Rd Unit 201
- 180 Old Post Rd Unit 405
- 180 Old Post Rd Unit 207
- 1 Roseland St Unit B-14
- 1 Maura Elizabeth Ln
- 24 Eastman Ave
- 174 E Foxboro St
- 214 Mechanic St
- 111 E Foxboro St
- 12 Beach St
- 120 Beach St
- 3 Wampanoag Rd
- 63 Forge Rd
- 0 U S Route 1
- 565 S Main St
- 565 S Main St Unit 565
- 565 S Main St Unit A
- 565 S Main St Unit B
- 567 S Main St Unit 569
- 552 S Main St
- 0 Wolomolopoag St
- 586 S Main St
- 537 S Main St Unit 539
- 539 S Main St
- LOT 81 S Walpole St
- 13 S Walpole St
- 11 S Walpole St
- 3 S Walpole St
- 4 S Walpole St
- 10 S Walpole St
- 6 S Walpole St
- 8 S Walpole St
- 619 S Main St
- 14 S Walpole St
Your Personal Tour Guide
Ask me questions while you tour the home.