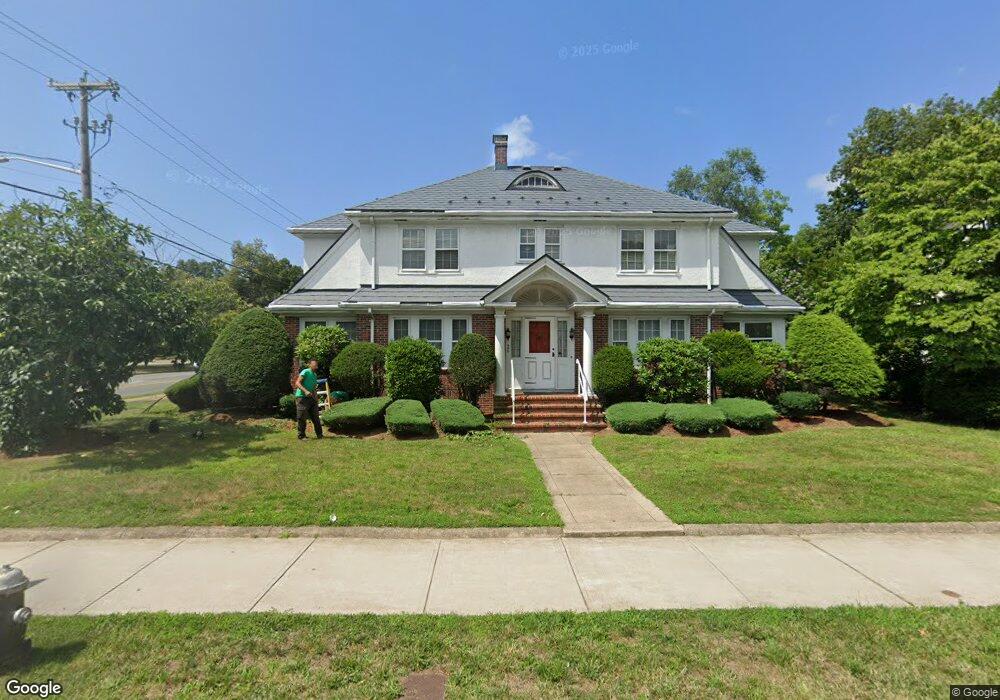
563 W Elm St Brockton, MA 02301
Estimated Value: $576,000 - $666,000
4
Beds
2
Baths
2,244
Sq Ft
$277/Sq Ft
Est. Value
About This Home
This home is located at 563 W Elm St, Brockton, MA 02301 and is currently estimated at $620,596, approximately $276 per square foot. 563 W Elm St is a home located in Plymouth County with nearby schools including Manthala George Jr. School, Hancock Elementary School, and Louis F Angelo Elementary School.
Ownership History
Date
Name
Owned For
Owner Type
Purchase Details
Closed on
May 6, 2019
Sold by
Alkins Leonard C and Alkins Carole A
Bought by
L & C Rt
Current Estimated Value
Create a Home Valuation Report for This Property
The Home Valuation Report is an in-depth analysis detailing your home's value as well as a comparison with similar homes in the area
Home Values in the Area
Average Home Value in this Area
Purchase History
| Date | Buyer | Sale Price | Title Company |
|---|---|---|---|
| L & C Rt | -- | -- |
Source: Public Records
Tax History Compared to Growth
Tax History
| Year | Tax Paid | Tax Assessment Tax Assessment Total Assessment is a certain percentage of the fair market value that is determined by local assessors to be the total taxable value of land and additions on the property. | Land | Improvement |
|---|---|---|---|---|
| 2025 | $6,547 | $540,600 | $149,700 | $390,900 |
| 2024 | $6,473 | $538,500 | $149,700 | $388,800 |
| 2023 | $6,403 | $493,300 | $115,000 | $378,300 |
| 2022 | $5,995 | $429,100 | $104,700 | $324,400 |
| 2021 | $5,664 | $390,600 | $98,000 | $292,600 |
| 2020 | $5,790 | $382,200 | $93,800 | $288,400 |
| 2019 | $5,455 | $351,000 | $87,900 | $263,100 |
| 2018 | $4,788 | $325,100 | $87,900 | $237,200 |
| 2017 | $4,788 | $297,400 | $87,900 | $209,500 |
| 2016 | $5,559 | $320,200 | $84,100 | $236,100 |
| 2015 | $5,305 | $292,300 | $84,100 | $208,200 |
| 2014 | $5,212 | $287,500 | $84,100 | $203,400 |
Source: Public Records
Map
Nearby Homes