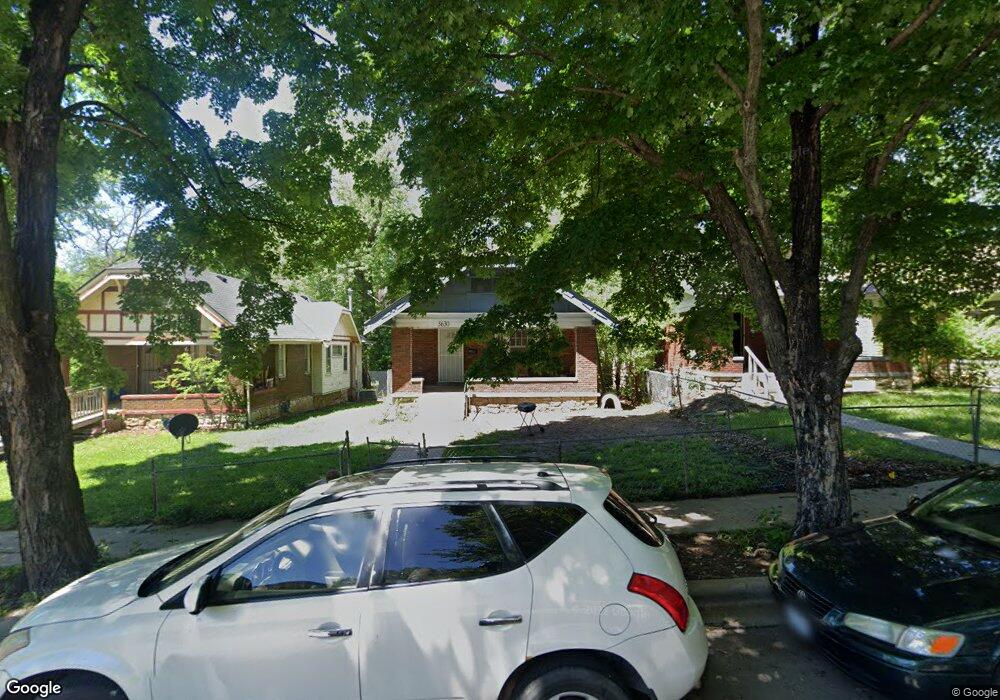
5630 Park Ave Kansas City, MO 64130
Blue Hills NeighborhoodEstimated Value: $88,000 - $124,000
3
Beds
1
Bath
1,086
Sq Ft
$101/Sq Ft
Est. Value
About This Home
This home is located at 5630 Park Ave, Kansas City, MO 64130 and is currently estimated at $109,248, approximately $100 per square foot. 5630 Park Ave is a home located in Jackson County with nearby schools including Troost Elementary School, M. L. King Elementary School, and Central Middle School.
Ownership History
Date
Name
Owned For
Owner Type
Purchase Details
Closed on
Aug 22, 2025
Sold by
Omardrive Acquisitions Llc
Bought by
Drivetime Assets Llc
Current Estimated Value
Home Financials for this Owner
Home Financials are based on the most recent Mortgage that was taken out on this home.
Original Mortgage
$1,054,500
Outstanding Balance
$1,053,592
Interest Rate
6.75%
Mortgage Type
New Conventional
Estimated Equity
-$944,344
Purchase Details
Closed on
Feb 11, 2019
Sold by
Rowen Real Estate Llc
Bought by
Omardrive Acquisitions Llc
Purchase Details
Closed on
Oct 17, 2018
Sold by
Kc Nexus Properties Llc
Bought by
Rowen Real Estate Llc
Purchase Details
Closed on
Oct 12, 2018
Sold by
Phillips Louvenia and Phillips Louvenia K
Bought by
Kc Nexus Properties Llc
Create a Home Valuation Report for This Property
The Home Valuation Report is an in-depth analysis detailing your home's value as well as a comparison with similar homes in the area
Home Values in the Area
Average Home Value in this Area
Purchase History
| Date | Buyer | Sale Price | Title Company |
|---|---|---|---|
| Drivetime Assets Llc | -- | Alpha Title | |
| Omardrive Acquisitions Llc | -- | None Available | |
| Rowen Real Estate Llc | -- | Alpha Title Guaranty Inc | |
| Kc Nexus Properties Llc | -- | Alpha Title Guaranty Inc |
Source: Public Records
Mortgage History
| Date | Status | Borrower | Loan Amount |
|---|---|---|---|
| Open | Drivetime Assets Llc | $1,054,500 |
Source: Public Records
Tax History Compared to Growth
Tax History
| Year | Tax Paid | Tax Assessment Tax Assessment Total Assessment is a certain percentage of the fair market value that is determined by local assessors to be the total taxable value of land and additions on the property. | Land | Improvement |
|---|---|---|---|---|
| 2025 | $696 | $8,292 | $3,616 | $4,676 |
| 2024 | $696 | $8,820 | $1,178 | $7,642 |
| 2023 | $690 | $8,820 | $703 | $8,117 |
| 2022 | $516 | $6,270 | $1,511 | $4,759 |
| 2021 | $514 | $6,270 | $1,511 | $4,759 |
| 2020 | $494 | $5,952 | $1,511 | $4,441 |
| 2019 | $484 | $5,952 | $1,511 | $4,441 |
| 2018 | $423 | $5,309 | $600 | $4,709 |
| 2017 | $423 | $5,309 | $600 | $4,709 |
| 2016 | $370 | $4,617 | $546 | $4,071 |
| 2014 | $371 | $4,617 | $546 | $4,071 |
Source: Public Records
Map
Nearby Homes
- 4041 Olive St
- 4043 Olive St
- 4045 Olive St
- 3921 Olive St
- 5824 Park Ave
- 5507 Park Ave
- 5521 Wabash Ave
- 5818 Prospect Ave
- 5442 Brooklyn Ave
- 5820 Prospect Ave
- 5437 Brooklyn Ave
- 5700 Woodland Ave
- 5630 Woodland Ave
- 5919 Wabash Ave
- 5541 Chestnut Ave
- 5528 Woodland Ave
- 1820 E 55th St
- 5629 Highland Ave
- 5400 Olive St
- 5711 Highland Ave