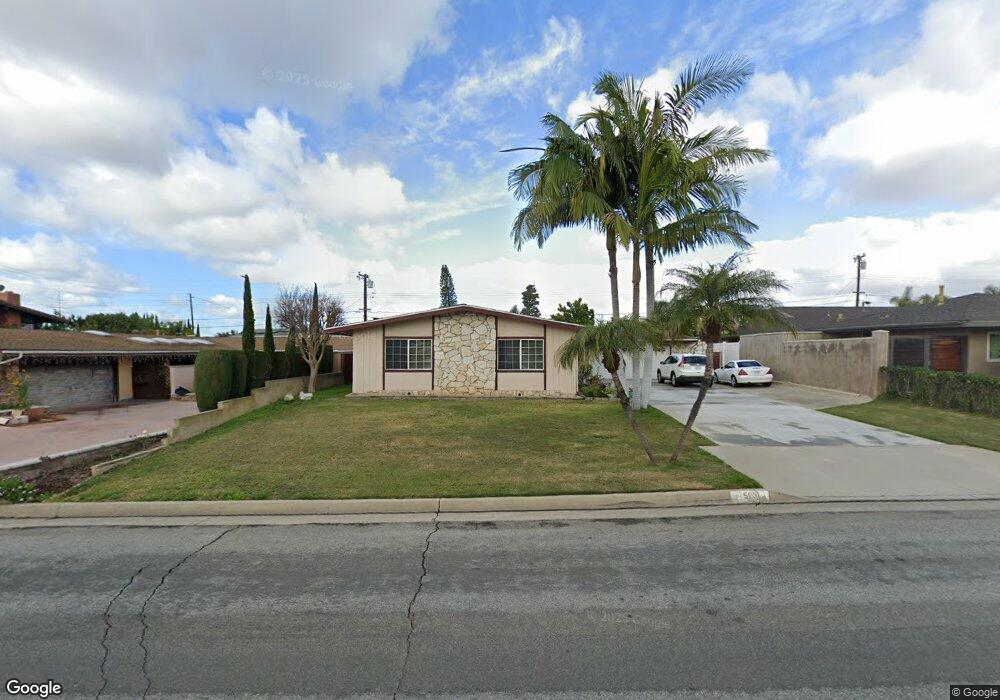
5631 Monticello Ave Buena Park, CA 90621
Estimated Value: $944,000 - $1,264,000
3
Beds
3
Baths
1,615
Sq Ft
$692/Sq Ft
Est. Value
About This Home
This home is located at 5631 Monticello Ave, Buena Park, CA 90621 and is currently estimated at $1,116,850, approximately $691 per square foot. 5631 Monticello Ave is a home located in Orange County with nearby schools including Charles G. Emery Elementary School, Buena Park Junior High School, and Sunny Hills High School.
Ownership History
Date
Name
Owned For
Owner Type
Purchase Details
Closed on
Jun 13, 2024
Sold by
Rudolph John David and Rudolph Lorraine
Bought by
Rudolph Revocable Living Trust and Rudolph
Current Estimated Value
Purchase Details
Closed on
Sep 24, 2002
Sold by
Stecher Fred and Stecher Carol
Bought by
Rudolph John D and Rudolph Lorraine
Home Financials for this Owner
Home Financials are based on the most recent Mortgage that was taken out on this home.
Original Mortgage
$295,000
Interest Rate
5.99%
Purchase Details
Closed on
Mar 30, 2000
Sold by
Amaximis Lending
Bought by
Stecher Fred and Stecher Carol
Home Financials for this Owner
Home Financials are based on the most recent Mortgage that was taken out on this home.
Original Mortgage
$204,000
Interest Rate
8.3%
Purchase Details
Closed on
Nov 4, 1999
Sold by
Hwan Yi Chong and Chi Su Chi
Bought by
Amaximis Lending
Create a Home Valuation Report for This Property
The Home Valuation Report is an in-depth analysis detailing your home's value as well as a comparison with similar homes in the area
Home Values in the Area
Average Home Value in this Area
Purchase History
| Date | Buyer | Sale Price | Title Company |
|---|---|---|---|
| Rudolph Revocable Living Trust | -- | None Listed On Document | |
| Rudolph John D | $409,000 | Commonwealth Land Title | |
| Stecher Fred | $255,000 | Chicago Title Co | |
| Amaximis Lending | $229,000 | Benefit Land Title Ins Co |
Source: Public Records
Mortgage History
| Date | Status | Borrower | Loan Amount |
|---|---|---|---|
| Previous Owner | Rudolph John D | $295,000 | |
| Previous Owner | Stecher Fred | $204,000 |
Source: Public Records
Tax History Compared to Growth
Tax History
| Year | Tax Paid | Tax Assessment Tax Assessment Total Assessment is a certain percentage of the fair market value that is determined by local assessors to be the total taxable value of land and additions on the property. | Land | Improvement |
|---|---|---|---|---|
| 2025 | $6,593 | $592,360 | $491,026 | $101,334 |
| 2024 | $6,593 | $580,746 | $481,398 | $99,348 |
| 2023 | $6,458 | $569,359 | $471,959 | $97,400 |
| 2022 | $6,355 | $558,196 | $462,705 | $95,491 |
| 2021 | $6,307 | $547,251 | $453,632 | $93,619 |
| 2020 | $6,229 | $541,640 | $448,980 | $92,660 |
| 2019 | $6,077 | $531,020 | $440,176 | $90,844 |
| 2018 | $5,959 | $520,608 | $431,545 | $89,063 |
| 2017 | $5,873 | $510,400 | $423,083 | $87,317 |
| 2016 | $5,754 | $500,393 | $414,788 | $85,605 |
| 2015 | $5,503 | $492,877 | $408,557 | $84,320 |
| 2014 | $5,485 | $483,223 | $400,554 | $82,669 |
Source: Public Records
Map
Nearby Homes
- 8542 Emerywood Dr
- 9 Coveside Ct
- 65 Windward Way Unit 23
- 8237 Henshaw Cir
- 11 Travis Rd
- 86 Lakeside Dr
- 5412 Arrowhead Ave
- 5588 Cajon Ave
- 6 Tidewater Cove
- 5211 Fox Hills Ave
- 5471 Jonesboro Way
- 5941 Stanton Ave
- 8244 Henderson Green
- 4900 Lincolnshire Ave
- 4014 W Commonwealth Ave
- 101 Turner Ave
- 4840 Sunnybrook Ave
- 5822 Fullerton Ave
- 8325 Beethoven Dr
- 4738 Durango Dr
- 5621 Monticello Ave
- 5641 Monticello Ave
- 5632 Burlingame Ave
- 5622 Burlingame Ave
- 5651 Monticello Ave
- 5601 Monticello Ave
- 5632 Monticello Ave
- 5642 Monticello Ave
- 5602 Burlingame Ave
- 5652 Burlingame Ave
- 5622 Monticello Ave
- 5652 Monticello Ave
- 5661 Monticello Ave
- 5591 Monticello Ave
- 5602 Monticello Ave
- 5662 Monticello Ave
- 5592 Burlingame Ave
- 5662 Burlingame Ave
- 5631 Burlingame Ave
- 5621 Burlingame Ave