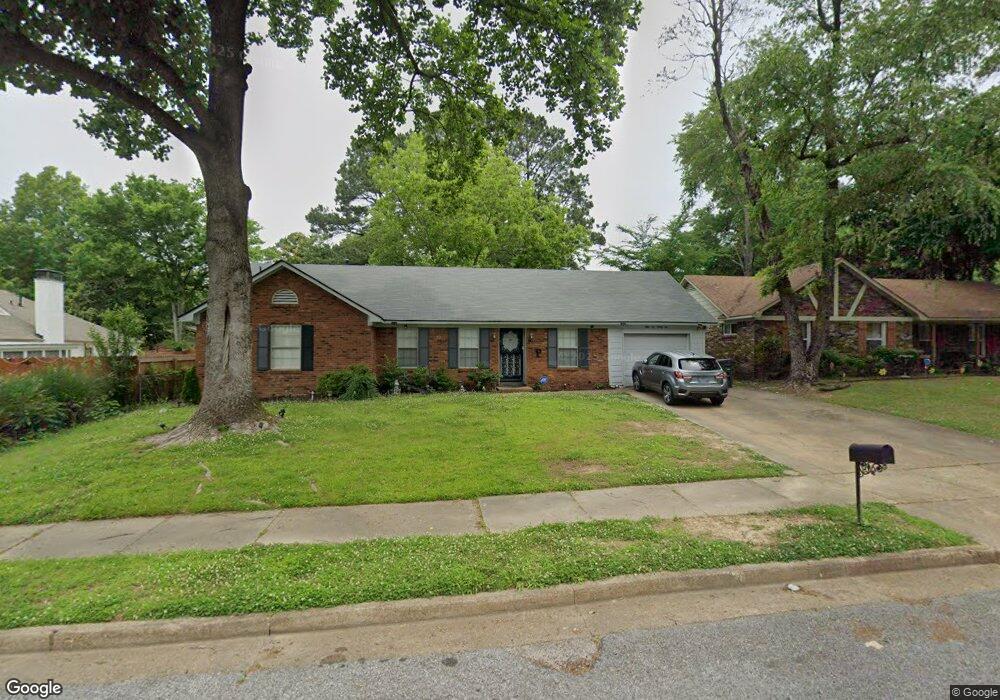
5632 Clarke Cove Memphis, TN 38115
Fox Meadows NeighborhoodEstimated Value: $134,000 - $180,000
3
Beds
2
Baths
1,426
Sq Ft
$114/Sq Ft
Est. Value
About This Home
This home is located at 5632 Clarke Cove, Memphis, TN 38115 and is currently estimated at $162,884, approximately $114 per square foot. 5632 Clarke Cove is a home located in Shelby County with nearby schools including Newberry Elementary School, Wooddale High School, and Compass Community School Hickory Hill Campus.
Ownership History
Date
Name
Owned For
Owner Type
Purchase Details
Closed on
Sep 8, 2021
Sold by
Melton Timothy
Bought by
Phillips Creshunda Y Hill
Current Estimated Value
Home Financials for this Owner
Home Financials are based on the most recent Mortgage that was taken out on this home.
Original Mortgage
$133,536
Outstanding Balance
$121,508
Interest Rate
2.8%
Mortgage Type
FHA
Estimated Equity
$41,376
Purchase Details
Closed on
Nov 10, 2009
Sold by
Melton Timothy A and Melton Carol L
Bought by
Melton Timothy
Home Financials for this Owner
Home Financials are based on the most recent Mortgage that was taken out on this home.
Original Mortgage
$45,160
Interest Rate
4.92%
Mortgage Type
New Conventional
Purchase Details
Closed on
Aug 9, 1996
Sold by
Kelly Kevin C
Bought by
Melton Timothy A and Melton Carol L
Home Financials for this Owner
Home Financials are based on the most recent Mortgage that was taken out on this home.
Original Mortgage
$70,143
Interest Rate
8.24%
Mortgage Type
FHA
Create a Home Valuation Report for This Property
The Home Valuation Report is an in-depth analysis detailing your home's value as well as a comparison with similar homes in the area
Home Values in the Area
Average Home Value in this Area
Purchase History
| Date | Buyer | Sale Price | Title Company |
|---|---|---|---|
| Phillips Creshunda Y Hill | $136,000 | None Listed On Document | |
| Melton Timothy | -- | Lsi | |
| Melton Timothy A | $70,250 | -- |
Source: Public Records
Mortgage History
| Date | Status | Borrower | Loan Amount |
|---|---|---|---|
| Open | Phillips Creshunda Y Hill | $133,536 | |
| Previous Owner | Melton Timothy | $45,160 | |
| Previous Owner | Melton Timothy A | $70,143 |
Source: Public Records
Tax History Compared to Growth
Tax History
| Year | Tax Paid | Tax Assessment Tax Assessment Total Assessment is a certain percentage of the fair market value that is determined by local assessors to be the total taxable value of land and additions on the property. | Land | Improvement |
|---|---|---|---|---|
| 2025 | $914 | $36,675 | $4,375 | $32,300 |
| 2024 | $914 | $26,975 | $3,900 | $23,075 |
| 2023 | $1,643 | $26,975 | $3,900 | $23,075 |
| 2022 | $1,643 | $26,975 | $3,900 | $23,075 |
| 2021 | $1,662 | $26,975 | $3,900 | $23,075 |
| 2020 | $1,172 | $16,175 | $3,900 | $12,275 |
| 2019 | $517 | $16,175 | $3,900 | $12,275 |
| 2018 | $517 | $16,175 | $3,900 | $12,275 |
| 2017 | $529 | $16,175 | $3,900 | $12,275 |
| 2016 | $735 | $16,825 | $0 | $0 |
| 2014 | $735 | $16,825 | $0 | $0 |
Source: Public Records
Map
Nearby Homes
- 3467 Fox Meadows Rd
- 3446 Fox Meadows Rd
- 3344 Scottsdale Cove
- 3257 Clarke Rd
- 5869 Scottsdale Ave
- 3340 Foxbriar Dr
- 3682 Hyacinth Dr
- 5531 Knight Arnold Rd
- 3693 Hyacinth Dr
- 3725 Wax Myrtle Dr
- 3461 Lichterman Rd
- 3754 Maple Leaf Cove
- 5694 Myers Rd
- 5655 Myers Rd
- 5586 Hyacinth Cove
- 3229 Thirteen Colony Mall Unit 5B
- 3243 Thirteen Colony Mall Unit 2B
- 3226 S Mendenhall Rd Unit 2B
- 3218 13 Colony Mall
- 3218 Thirteen Colony Mall Unit 1A
- 5638 Clarke Cove
- 5628 Clarke Cove Unit 12
- 3450 Clarke Rd
- 5614 Clarke Cove
- 3440 Clarke Rd
- 5646 Clarke Cove
- 3423 Gaywinds Cove
- 5633 Clarke Cove
- 5639 Clarke Cove
- 3434 Clarke Rd
- 3424 Gaywinds Cove
- 5625 Clarke Cove
- 5650 Clarke Cove
- 3419 Gaywinds Cove
- 3426 Clarke Rd
- 3451 Clarke Rd
- 5652 Clarke Cove
- 3443 Clarke Rd
- 3457 Clarke Rd
- 3420 Gaywinds Cove