5632 N Watervliet Rd Unit 21 Watervliet, MI 49098
Estimated Value: $420,213 - $535,000
3
Beds
2
Baths
1,255
Sq Ft
$363/Sq Ft
Est. Value
About This Home
This home is located at 5632 N Watervliet Rd Unit 21, Watervliet, MI 49098 and is currently estimated at $455,053, approximately $362 per square foot. 5632 N Watervliet Rd Unit 21 is a home located in Berrien County with nearby schools including North Elementary School, South Elementary School, and Watervliet Middle School.
Ownership History
Date
Name
Owned For
Owner Type
Purchase Details
Closed on
Nov 10, 2015
Sold by
Lullo Robert M and Lullo Maryanne
Bought by
Lullo Robert M and Lullo Maryanne
Current Estimated Value
Purchase Details
Closed on
Sep 12, 2003
Sold by
Madanguit Aurora B
Bought by
Lullo Robert M and Lullo Maryanne
Home Financials for this Owner
Home Financials are based on the most recent Mortgage that was taken out on this home.
Original Mortgage
$93,000
Outstanding Balance
$43,617
Interest Rate
6.4%
Mortgage Type
Unknown
Estimated Equity
$411,436
Purchase Details
Closed on
Nov 30, 1998
Purchase Details
Closed on
Jul 30, 1998
Purchase Details
Closed on
Feb 11, 1998
Purchase Details
Closed on
Jun 20, 1986
Create a Home Valuation Report for This Property
The Home Valuation Report is an in-depth analysis detailing your home's value as well as a comparison with similar homes in the area
Home Values in the Area
Average Home Value in this Area
Purchase History
| Date | Buyer | Sale Price | Title Company |
|---|---|---|---|
| Lullo Robert M | -- | Attorney | |
| Lullo Robert M | $193,000 | -- | |
| -- | $148,400 | -- | |
| -- | -- | -- | |
| -- | $100 | -- | |
| -- | -- | -- |
Source: Public Records
Mortgage History
| Date | Status | Borrower | Loan Amount |
|---|---|---|---|
| Open | Lullo Robert M | $93,000 |
Source: Public Records
Tax History Compared to Growth
Tax History
| Year | Tax Paid | Tax Assessment Tax Assessment Total Assessment is a certain percentage of the fair market value that is determined by local assessors to be the total taxable value of land and additions on the property. | Land | Improvement |
|---|---|---|---|---|
| 2025 | $5,472 | $169,100 | $0 | $0 |
| 2024 | $4,039 | $149,400 | $0 | $0 |
| 2023 | $3,846 | $135,500 | $0 | $0 |
| 2022 | $3,714 | $101,500 | $0 | $0 |
| 2021 | $4,897 | $97,600 | $0 | $0 |
| 2020 | $4,879 | $98,200 | $0 | $0 |
| 2019 | $4,808 | $108,500 | $0 | $0 |
| 2018 | $4,657 | $98,400 | $0 | $0 |
| 2017 | $4,595 | $99,800 | $0 | $0 |
| 2016 | $4,524 | $99,300 | $0 | $0 |
| 2015 | $4,522 | $99,200 | $0 | $0 |
| 2014 | $3,103 | $92,900 | $0 | $0 |
Source: Public Records
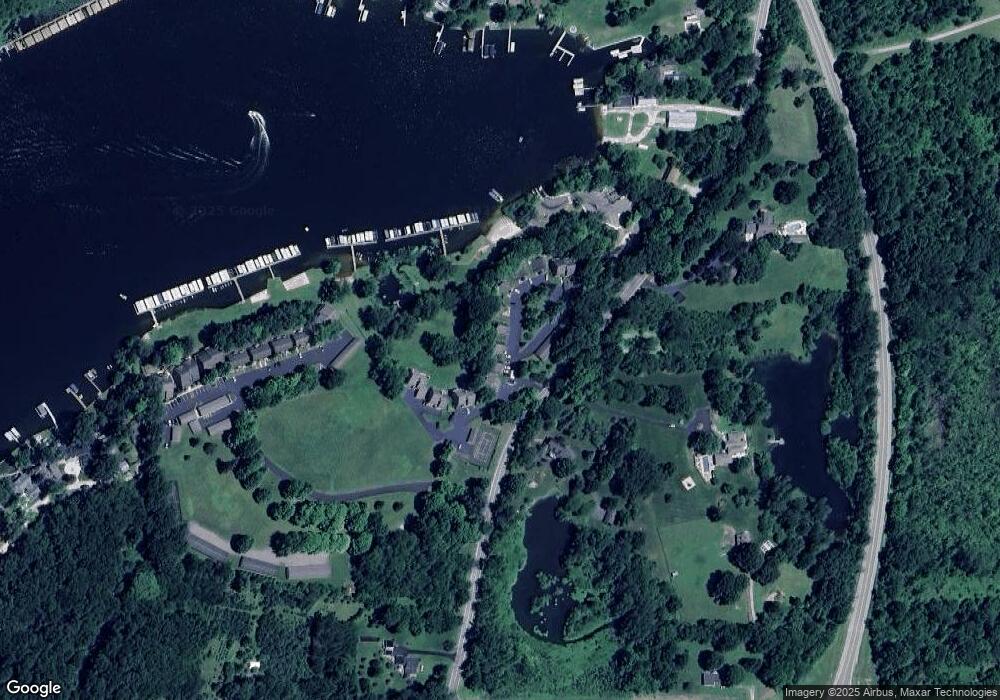
Map
Nearby Homes
- 5632 N Watervliet Rd Unit 16
- 8683 Heron Ct Unit 29
- 8655 Heron Ct Unit 32
- 5967 Osprey Ln Unit 5
- 6206 Paw Lake Rd
- 6030 Paw Lake Rd
- 8710 Hagar Shore Rd
- 4875 N Watervliet Rd
- 4958 Forest Park Ave
- 4751 Harlan Dr Unit 17
- 5586 Paw Lake Rd
- 21 Harlan Dr
- 1 Harlan Dr
- 7574 Little Paw Lake Rd
- 572 Waters Way
- 5568 Paw Lake Rd
- 1025 Richard Ave
- 924 Richard Ave
- 704 & 712 Courtyard Place
- 415 Riverside Dr
- 5632 N Watervliet Rd Unit 36
- 5632 N Watervliet Rd Unit 35
- 5632 N Watervliet Rd
- 5632 N Watervliet Rd
- 5632 N Watervliet Rd Unit 26
- 5632 N Watervliet Rd Unit 25
- 5632 N Watervliet Rd Unit 20
- 5632 N Watervliet Rd
- 5632 N Watervliet Rd Unit 17
- 5632 N Watervliet Rd
- 5632 N Watervliet Rd
- 5632 N Watervliet Rd
- 5632 N Watervliet Rd
- 5632 N Watervliet Rd Unit 10
- 5632 N Watervliet Rd Unit 9
- 5632 N Watervliet Rd
- 5632 N Watervliet Rd
- 5632 N Watervliet Rd Unit 6
- 5632 N Watervliet Rd
- 5632 N Watervliet Rd