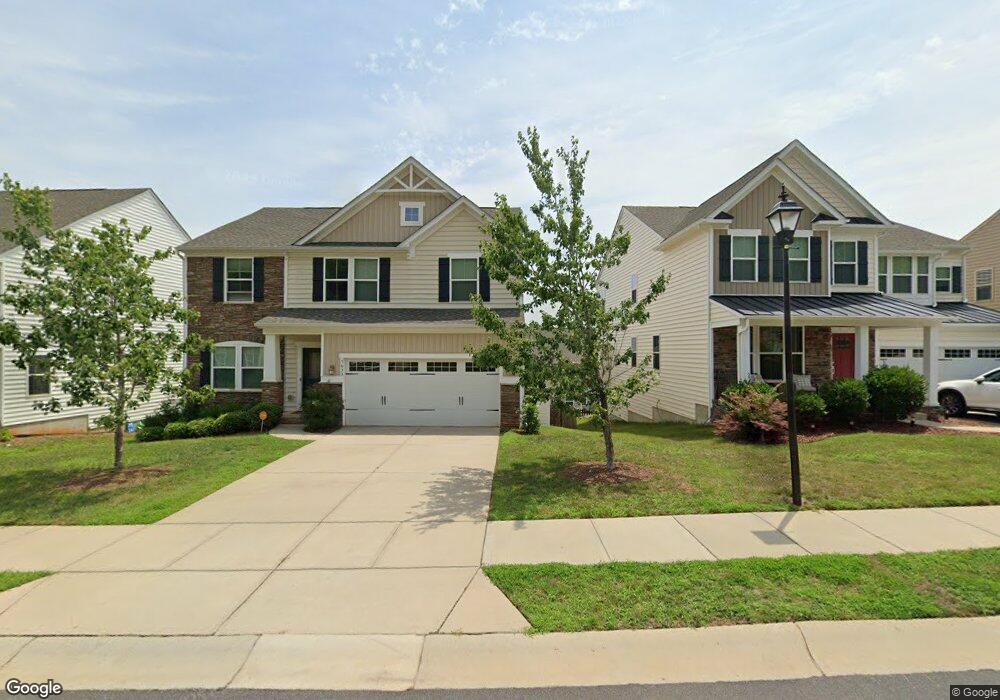
5633 Selkirkshire Rd Unit 107 Charlotte, NC 28278
Dixie-Berryhill NeighborhoodEstimated Value: $522,237 - $563,000
3
Beds
3
Baths
3,070
Sq Ft
$177/Sq Ft
Est. Value
About This Home
This home is located at 5633 Selkirkshire Rd Unit 107, Charlotte, NC 28278 and is currently estimated at $543,309, approximately $176 per square foot. 5633 Selkirkshire Rd Unit 107 is a home located in Mecklenburg County with nearby schools including Kennedy Middle School, Olympic High School, and Southwest Charlotte STEM Academy.
Ownership History
Date
Name
Owned For
Owner Type
Purchase Details
Closed on
May 21, 2025
Sold by
K & T Investment Solutions Llc
Bought by
Dawkins Kendra
Current Estimated Value
Purchase Details
Closed on
Nov 23, 2020
Sold by
Baker Amanda and Baker Jerone
Bought by
K & T Investment Solutions Llc
Home Financials for this Owner
Home Financials are based on the most recent Mortgage that was taken out on this home.
Original Mortgage
$276,500
Interest Rate
2.8%
Mortgage Type
Commercial
Purchase Details
Closed on
Mar 2, 2016
Sold by
Nvr Inc A Virginia Corp
Bought by
Baker Amanda and Baker Jerone
Home Financials for this Owner
Home Financials are based on the most recent Mortgage that was taken out on this home.
Original Mortgage
$252,299
Interest Rate
3.25%
Mortgage Type
FHA
Purchase Details
Closed on
Dec 17, 2015
Sold by
Klp Selkirk Llc
Bought by
Nvr Inc
Create a Home Valuation Report for This Property
The Home Valuation Report is an in-depth analysis detailing your home's value as well as a comparison with similar homes in the area
Home Values in the Area
Average Home Value in this Area
Purchase History
| Date | Buyer | Sale Price | Title Company |
|---|---|---|---|
| Dawkins Kendra | -- | None Listed On Document | |
| K & T Investment Solutions Llc | $395,000 | None Available | |
| Baker Amanda | $257,000 | None Available | |
| Nvr Inc | $100,000 | None Available |
Source: Public Records
Mortgage History
| Date | Status | Borrower | Loan Amount |
|---|---|---|---|
| Previous Owner | K & T Investment Solutions Llc | $276,500 | |
| Previous Owner | Baker Amanda | $252,299 |
Source: Public Records
Tax History Compared to Growth
Tax History
| Year | Tax Paid | Tax Assessment Tax Assessment Total Assessment is a certain percentage of the fair market value that is determined by local assessors to be the total taxable value of land and additions on the property. | Land | Improvement |
|---|---|---|---|---|
| 2025 | $3,331 | $477,200 | $76,500 | $400,700 |
| 2024 | $3,331 | $477,200 | $76,500 | $400,700 |
| 2023 | $3,331 | $477,200 | $76,500 | $400,700 |
| 2022 | $2,955 | $325,200 | $51,000 | $274,200 |
| 2021 | $2,885 | $325,200 | $51,000 | $274,200 |
| 2020 | $2,869 | $325,200 | $51,000 | $274,200 |
| 2019 | $2,836 | $325,200 | $51,000 | $274,200 |
| 2018 | $2,946 | $261,100 | $48,500 | $212,600 |
| 2017 | $2,923 | $261,100 | $48,500 | $212,600 |
| 2016 | $532 | $48,500 | $48,500 | $0 |
| 2015 | -- | $0 | $0 | $0 |
| 2014 | -- | $0 | $0 | $0 |
Source: Public Records
Map
Nearby Homes
- 5709 Selkirkshire Rd
- 6726 Carradale Way
- 5918 Kelyn Hills Dr
- 7705 Hamilton Bridge Rd
- 7234 Kinley Commons Ln
- 7042 Evanton Loch Rd
- 7108 Kinley Commons Ln
- 9229 Inverness Bay Rd
- 9013 Gailes Dr
- 9524 Birkwood Ct
- 9510 Birkwood Ct
- 9614 Springholm Dr
- 10817 Bere Island Dr
- 7223 Lochy Ln
- 7325 Dulnian Way
- 7333 Dulnian Way
- 8924 Oransay Way
- 6618 Latherton Ln
- 5933 Kirkwynd Commons Dr
- 9213 Seamill Rd
- 5633 Selkirkshire Rd
- 5629 Selkirkshire Rd Unit 107
- 5629 Selkirkshire Rd Unit 106
- 5637 Selkirkshire Rd Unit 108
- 5625 Selkirkshire Rd Unit 105
- 5703 Selkirkshire Rd
- 5703 Selkirkshire Rd Unit 109
- 2610 Peebles Ln
- 2614 Peebles Ln Unit 116
- 2614 Peebles Ln
- 5632 Selkirkshire Rd Unit 57
- 2606 Peebles Ln Unit 118
- 5700 Selkirkshire Rd Unit 59
- 5621 Selkirkshire Rd Unit 104
- 5621 Selkirkshire Rd
- 2702 Peebles Ln
- 2702 Peebles Ln Unit 115
- 5709 Selkirkshire Rd Unit 110
- 5636 Selkirkshire Rd
- 5636 Selkirkshire Rd Unit 58