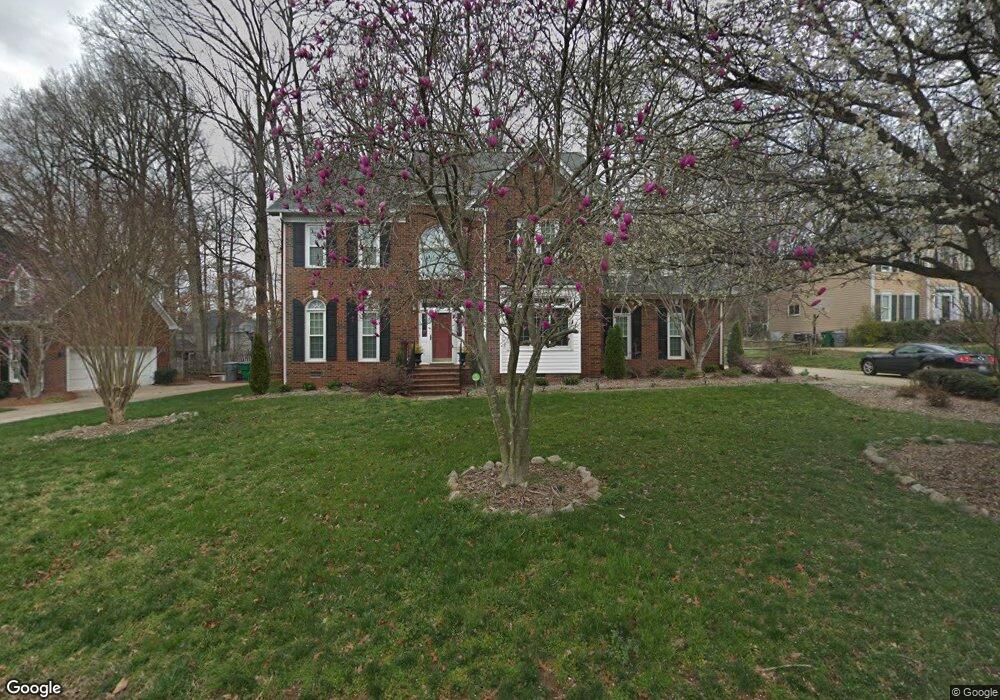
5635 Rocky Trail Ct Unit 57 Charlotte, NC 28270
Providence NeighborhoodEstimated Value: $787,242 - $851,000
4
Beds
3
Baths
3,121
Sq Ft
$261/Sq Ft
Est. Value
About This Home
This home is located at 5635 Rocky Trail Ct Unit 57, Charlotte, NC 28270 and is currently estimated at $814,061, approximately $260 per square foot. 5635 Rocky Trail Ct Unit 57 is a home located in Mecklenburg County with nearby schools including Providence Spring Elementary, Crestdale Middle School, and Providence High.
Ownership History
Date
Name
Owned For
Owner Type
Purchase Details
Closed on
Feb 24, 2016
Sold by
Day Richard Clayton and Day Sachiko Kaneko
Bought by
Faith Stafanie and Faith Garrett
Current Estimated Value
Home Financials for this Owner
Home Financials are based on the most recent Mortgage that was taken out on this home.
Original Mortgage
$156,000
Outstanding Balance
$124,570
Interest Rate
3.92%
Mortgage Type
New Conventional
Estimated Equity
$689,491
Purchase Details
Closed on
Jan 21, 2011
Sold by
Day Richard C and Day Sachiko K
Bought by
Day Richard Clayton and Richard Clayton Day Revocable Living Tru
Home Financials for this Owner
Home Financials are based on the most recent Mortgage that was taken out on this home.
Original Mortgage
$94,122
Interest Rate
4.79%
Mortgage Type
New Conventional
Purchase Details
Closed on
Nov 10, 2010
Sold by
Day Richard C and Day Sachiko K
Bought by
Day Richard Clayton and Day Sachiko Kaneko
Create a Home Valuation Report for This Property
The Home Valuation Report is an in-depth analysis detailing your home's value as well as a comparison with similar homes in the area
Home Values in the Area
Average Home Value in this Area
Purchase History
| Date | Buyer | Sale Price | Title Company |
|---|---|---|---|
| Faith Stafanie | $343,000 | None Available | |
| Day Richard Clayton | -- | Lsi | |
| Day Richard C | -- | Lsi | |
| Day Richard Clayton | -- | None Available |
Source: Public Records
Mortgage History
| Date | Status | Borrower | Loan Amount |
|---|---|---|---|
| Open | Faith Stafanie | $156,000 | |
| Previous Owner | Day Richard C | $94,122 |
Source: Public Records
Tax History Compared to Growth
Tax History
| Year | Tax Paid | Tax Assessment Tax Assessment Total Assessment is a certain percentage of the fair market value that is determined by local assessors to be the total taxable value of land and additions on the property. | Land | Improvement |
|---|---|---|---|---|
| 2025 | $3,883 | $626,600 | $140,000 | $486,600 |
| 2024 | $3,883 | $626,600 | $140,000 | $486,600 |
| 2023 | $4,735 | $626,600 | $140,000 | $486,600 |
| 2022 | $4,521 | $455,500 | $130,000 | $325,500 |
| 2021 | $4,510 | $455,500 | $130,000 | $325,500 |
| 2020 | $4,503 | $455,500 | $130,000 | $325,500 |
| 2019 | $4,487 | $455,500 | $130,000 | $325,500 |
| 2018 | $4,648 | $348,700 | $75,000 | $273,700 |
| 2017 | $4,577 | $348,700 | $75,000 | $273,700 |
| 2016 | $4,567 | $348,700 | $75,000 | $273,700 |
| 2015 | $4,556 | $348,700 | $75,000 | $273,700 |
| 2014 | $4,541 | $348,700 | $75,000 | $273,700 |
Source: Public Records
Map
Nearby Homes
- 3439 Twelve Oaks Place
- 5500 Flowering Dogwood Ln
- 5604 Flowering Dogwood Ln
- 3011 Mckee Rd
- 2919 Redfield Dr
- 2825 Redfield Dr
- 3316 Mckee Rd
- 2624 Brook Hollow Rd
- 2917 Misty Hill Ln
- 1903 Dundalk Rd
- 2032 Galty Ln
- 3113 Plantation Rd
- 3536 Arborhill Rd
- 3306 Nancy Creek Rd
- 7229 Corduroy Ct
- 3510 Cole Mill Rd
- 3021 Poplar Hill Rd
- 6800 Augustine Way
- 5633 Open Book Ln
- 2932 Wheat Meadow Ln
- 5635 Rocky Trail Ct
- 5631 Rocky Trail Ct
- 5641 Rocky Trail Ct
- 5614 Red Osier Ct
- 5612 Red Osier Ct
- 5642 Rocky Trail Ct
- 5625 Rocky Trail Ct
- 5634 Rocky Trail Ct
- 5643 Rocky Trail Ct
- 5638 Rocky Trail Ct
- 5644 Rocky Trail Ct
- 5630 Rocky Trail Ct
- 5608 Red Osier Ct
- 5616 Red Osier Ct
- 5624 Rocky Trail Ct
- 5619 Rocky Trail Ct
- 5604 Red Osier Ct
- 3311 Twelve Oaks Place
- 5618 Rocky Trail Ct
- 3315 Twelve Oaks Place