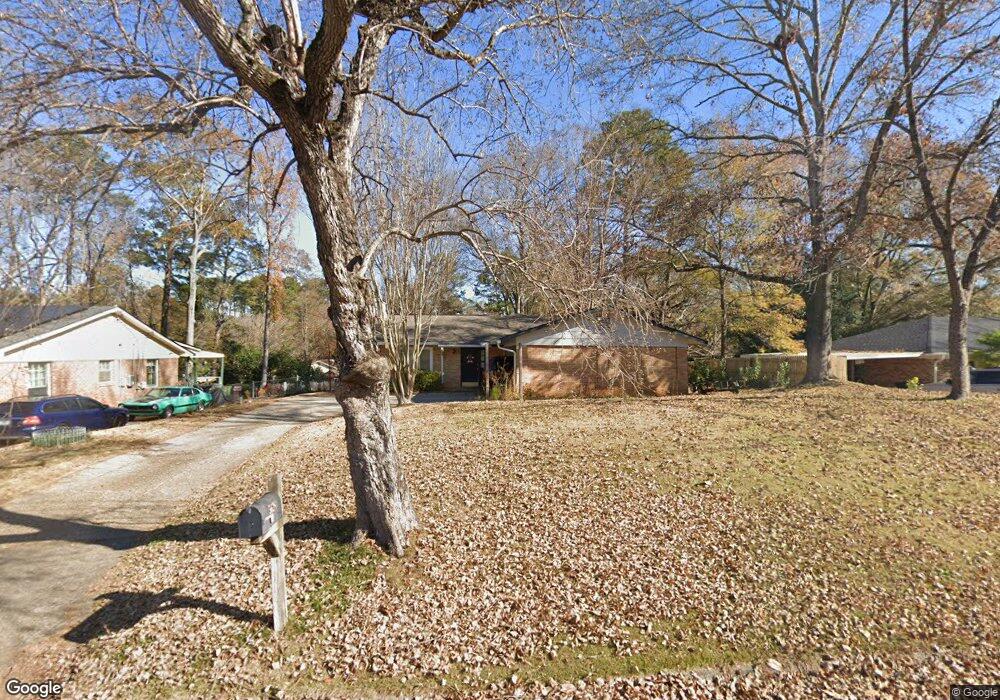
5638 Neassie St Columbus, GA 31909
Estimated Value: $230,110 - $258,000
3
Beds
3
Baths
1,838
Sq Ft
$131/Sq Ft
Est. Value
About This Home
This home is located at 5638 Neassie St, Columbus, GA 31909 and is currently estimated at $241,528, approximately $131 per square foot. 5638 Neassie St is a home located in Muscogee County with nearby schools including Allen Elementary School, Arnold Middle School, and Jordan Vocational High School.
Ownership History
Date
Name
Owned For
Owner Type
Purchase Details
Closed on
Feb 2, 2017
Sold by
Head Randolph E
Bought by
Farmer Ryan M and Farmer Victoria Marie
Current Estimated Value
Home Financials for this Owner
Home Financials are based on the most recent Mortgage that was taken out on this home.
Original Mortgage
$116,303
Outstanding Balance
$96,062
Interest Rate
4.2%
Mortgage Type
New Conventional
Estimated Equity
$145,466
Purchase Details
Closed on
Oct 15, 2010
Sold by
Head Randolph E and Head Peggy O
Bought by
Head Randolph E and Head Peggy O
Create a Home Valuation Report for This Property
The Home Valuation Report is an in-depth analysis detailing your home's value as well as a comparison with similar homes in the area
Home Values in the Area
Average Home Value in this Area
Purchase History
| Date | Buyer | Sale Price | Title Company |
|---|---|---|---|
| Farmer Ryan M | $119,900 | -- | |
| Head Randolph E | -- | None Available |
Source: Public Records
Mortgage History
| Date | Status | Borrower | Loan Amount |
|---|---|---|---|
| Open | Farmer Ryan M | $116,303 |
Source: Public Records
Tax History Compared to Growth
Tax History
| Year | Tax Paid | Tax Assessment Tax Assessment Total Assessment is a certain percentage of the fair market value that is determined by local assessors to be the total taxable value of land and additions on the property. | Land | Improvement |
|---|---|---|---|---|
| 2025 | $2,739 | $69,964 | $9,276 | $60,688 |
| 2024 | $2,739 | $69,964 | $9,276 | $60,688 |
| 2023 | $2,756 | $69,964 | $9,276 | $60,688 |
| 2022 | $2,400 | $58,780 | $9,276 | $49,504 |
| 2021 | $2,088 | $51,144 | $9,276 | $41,868 |
| 2020 | $2,089 | $51,144 | $9,276 | $41,868 |
| 2019 | $2,095 | $51,144 | $9,276 | $41,868 |
| 2018 | $1,965 | $47,960 | $8,720 | $39,240 |
| 2017 | $2,089 | $50,832 | $9,276 | $41,556 |
| 2016 | $1,369 | $33,189 | $5,136 | $28,053 |
| 2015 | $1,371 | $33,189 | $5,136 | $28,053 |
| 2014 | $1,372 | $33,189 | $5,136 | $28,053 |
| 2013 | -- | $33,189 | $5,136 | $28,053 |
Source: Public Records
Map
Nearby Homes
- 5817 Sherborne Dr
- 5836 Sherborne Dr
- 3308 Mustang Dr
- 5435 Wayne Dr
- 3618 Grier Ave
- 3710 Winkfield Place
- 5610 Perry Ave
- 5552 Perry Ave
- 5829 Ventura Dr
- 6138 Seaton Dr
- 3325 N North Quay Dr
- 6221 Charing Dr
- 3427 Larkin St
- 6200 Karen Ct
- 5829 Moon Rd
- 4036 Wilbur Dr
- 3204 Weems Rd
- 6308 Adams Park Dr
- 5517 Rodgers Dr
- 5540 Rodgers Dr
- 5630 Neassie St
- 5644 Neassie St
- 5650 Neassie St
- 5631 Winvelly Dr
- 5625 Winvelly Dr
- 6 Neassie Ct
- 5656 Neassie St
- 5637 Winvelly Dr
- 5620 Neassie St
- 5619 Winvelly Dr
- 1 Neassie Ct
- 5643 Winvelly Dr
- 5623 Neassie St
- 5662 Neassie St
- 5614 Neassie St
- 5 Neassie Ct
- 5672 Canberra Ave
- 2 Neassie Ct
- 5609 Neassie St
- 5607 Winvelly Dr