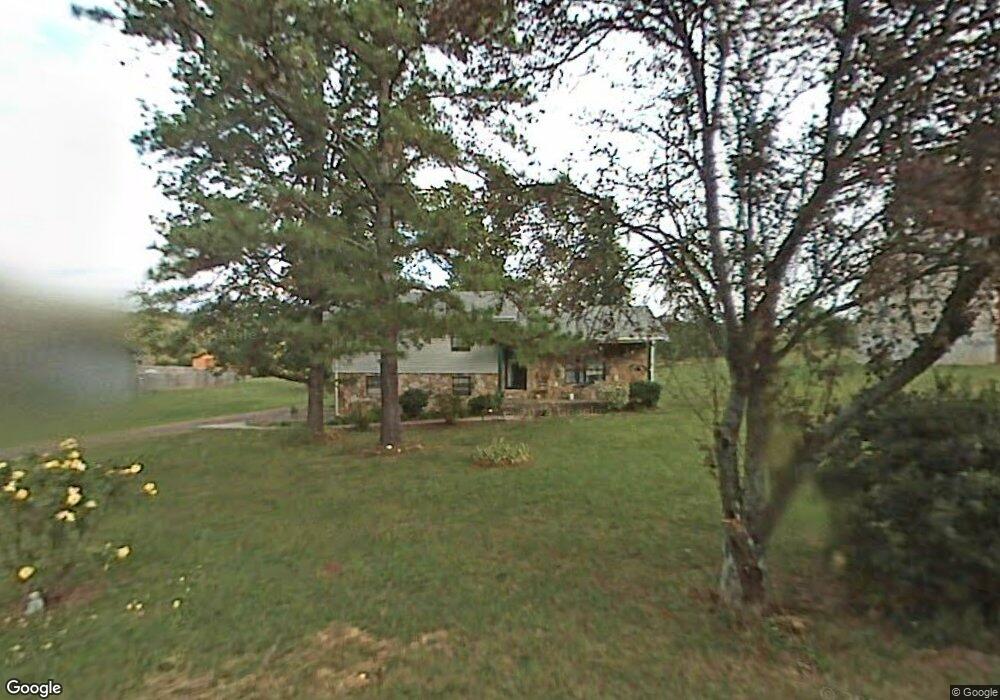
564 Diamond Cir La Fayette, GA 30728
Noble NeighborhoodEstimated Value: $224,221 - $282,000
4
Beds
2
Baths
1,900
Sq Ft
$134/Sq Ft
Est. Value
About This Home
This home is located at 564 Diamond Cir, La Fayette, GA 30728 and is currently estimated at $254,055, approximately $133 per square foot. 564 Diamond Cir is a home located in Walker County with nearby schools including Rock Spring Elementary School and Lafayette High School.
Ownership History
Date
Name
Owned For
Owner Type
Purchase Details
Closed on
Mar 11, 2004
Sold by
Cavanah Amy E
Bought by
Cockrell Sharron R
Current Estimated Value
Purchase Details
Closed on
Aug 15, 2002
Sold by
Bank Of New York
Bought by
Cavanah Amy E
Purchase Details
Closed on
Aug 7, 2001
Sold by
Gammon Carla M
Bought by
Bank Of New York
Purchase Details
Closed on
Apr 28, 1992
Sold by
Gammon Robert B and Gammon Carla
Bought by
Gammon Carla M
Purchase Details
Closed on
Jan 6, 1978
Sold by
Shaw Oliver N and Shaw Ann
Bought by
Gammon Robert B and Gammon Carla
Purchase Details
Closed on
May 23, 1977
Sold by
Mathis C H
Bought by
Shaw Oliver N and Shaw Ann
Purchase Details
Closed on
Feb 28, 1975
Sold by
Hicks George W and Hicks Harry E
Bought by
Mathis C H
Purchase Details
Closed on
Jan 1, 1972
Bought by
Hicks George W and Hicks Harry E
Create a Home Valuation Report for This Property
The Home Valuation Report is an in-depth analysis detailing your home's value as well as a comparison with similar homes in the area
Home Values in the Area
Average Home Value in this Area
Purchase History
| Date | Buyer | Sale Price | Title Company |
|---|---|---|---|
| Cockrell Sharron R | $89,500 | -- | |
| Cavanah Amy E | $79,800 | -- | |
| Bank Of New York | -- | -- | |
| Gammon Carla M | -- | -- | |
| Gammon Robert B | -- | -- | |
| Shaw Oliver N | -- | -- | |
| Mathis C H | -- | -- | |
| Hicks George W | -- | -- |
Source: Public Records
Tax History Compared to Growth
Tax History
| Year | Tax Paid | Tax Assessment Tax Assessment Total Assessment is a certain percentage of the fair market value that is determined by local assessors to be the total taxable value of land and additions on the property. | Land | Improvement |
|---|---|---|---|---|
| 2024 | $1,764 | $79,900 | $7,360 | $72,540 |
| 2023 | $1,712 | $75,875 | $7,360 | $68,515 |
| 2022 | $1,620 | $66,141 | $7,360 | $58,781 |
| 2021 | $1,191 | $43,242 | $3,680 | $39,562 |
| 2020 | $1,002 | $34,659 | $3,680 | $30,979 |
| 2019 | $985 | $33,407 | $3,680 | $29,727 |
| 2018 | $884 | $33,407 | $3,680 | $29,727 |
| 2017 | $1,078 | $33,407 | $3,680 | $29,727 |
| 2016 | $899 | $33,407 | $3,680 | $29,727 |
| 2015 | $850 | $29,648 | $4,400 | $25,248 |
| 2014 | $763 | $29,648 | $4,400 | $25,248 |
| 2013 | -- | $29,648 | $4,400 | $25,248 |
Source: Public Records
Map
Nearby Homes
- 663 Diamond Cir
- 906 Diamond Cir
- 516 W Reed Rd
- Lot 3 Cedar Farm Rd
- 4582 Highway N 27
- 4544 N Highway 27
- 4654 Us Highway 27
- 63 Loughridge Ln
- 329 Lynn Trail
- 521 Wheeler Rd
- 0 Straight Gut Rd Unit 1521484
- 0 Veeler Rd Unit 1522679
- 0 Veeler Rd Unit 10628696
- 0 E Warren Rd Unit RTC2681365
- 0 E Warren Rd Unit 1395828
- Hanover Plan at Price's Crossing
- Cali Plan at Price's Crossing
- Belhaven Plan at Price's Crossing
- Aria Plan at Price's Crossing
- Penwell Plan at Price's Crossing
- 542 Diamond Cir
- 586 Diamond Cir
- 524 Diamond Cir
- 591 Diamond Cir
- 561 Diamond Cir
- 516 Diamond Cir
- 487 Diamond Cir
- 606 Diamond Cir
- 604 Diamond Cir
- 533 Diamond Cir
- 649 Diamond Cir
- 633 Diamond Cir
- 514 Diamond Cir
- 614 Diamond Cir
- 465 Diamond Cir
- 498 Diamond Cir
- 626 Diamond Cir
- 612 Diamond Cir
- 451 Diamond Cir
- 474 Diamond Cir