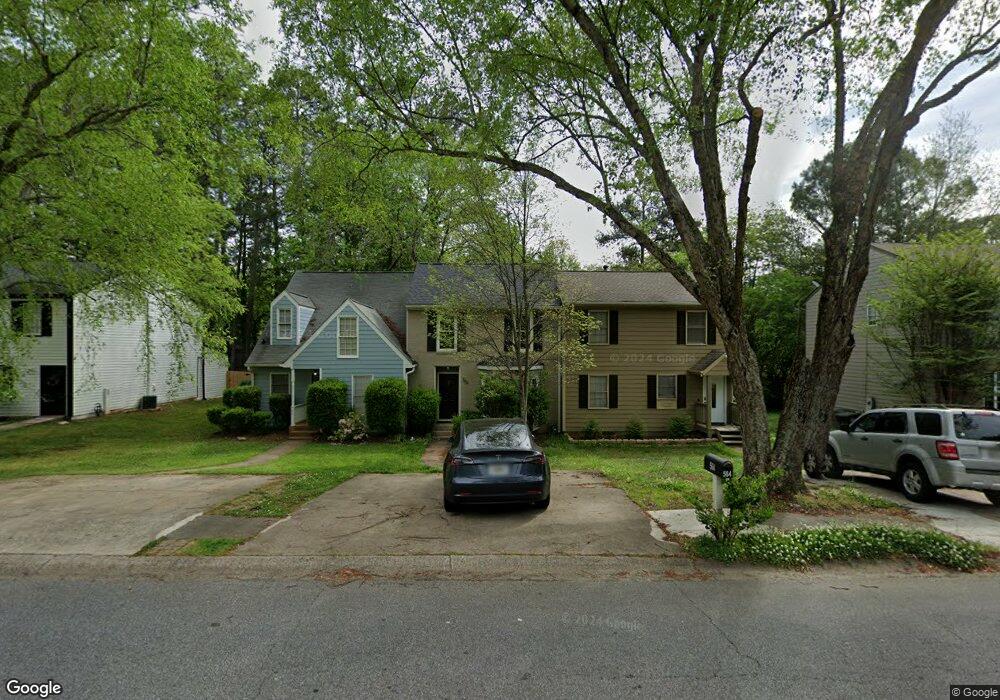
564 Manning Rd SW Unit 1/2 Marietta, GA 30064
Southwestern Marietta NeighborhoodEstimated Value: $244,000 - $290,000
3
Beds
2
Baths
1,286
Sq Ft
$204/Sq Ft
Est. Value
About This Home
This home is located at 564 Manning Rd SW Unit 1/2, Marietta, GA 30064 and is currently estimated at $262,415, approximately $204 per square foot. 564 Manning Rd SW Unit 1/2 is a home located in Cobb County with nearby schools including A.L. Burruss Elementary School, Marietta Sixth Grade Academy, and Marietta Middle School.
Ownership History
Date
Name
Owned For
Owner Type
Purchase Details
Closed on
Apr 27, 2023
Sold by
Copeland Jeffrey Scott
Bought by
Copeland Jordan
Current Estimated Value
Purchase Details
Closed on
Oct 31, 2022
Sold by
Copeland Jordan
Bought by
Copeland Jeffery Scott
Purchase Details
Closed on
Jun 30, 2017
Sold by
Richard Weiler
Bought by
Jordan Copeland
Home Financials for this Owner
Home Financials are based on the most recent Mortgage that was taken out on this home.
Original Mortgage
$115,900
Interest Rate
3.94%
Mortgage Type
New Conventional
Purchase Details
Closed on
Feb 28, 2000
Sold by
Kendell Kellee
Bought by
Weiler Richard
Home Financials for this Owner
Home Financials are based on the most recent Mortgage that was taken out on this home.
Original Mortgage
$86,491
Interest Rate
8.3%
Mortgage Type
FHA
Create a Home Valuation Report for This Property
The Home Valuation Report is an in-depth analysis detailing your home's value as well as a comparison with similar homes in the area
Home Values in the Area
Average Home Value in this Area
Purchase History
| Date | Buyer | Sale Price | Title Company |
|---|---|---|---|
| Copeland Jordan | -- | None Listed On Document | |
| Copeland Jeffery Scott | -- | -- | |
| Jordan Copeland | $122,000 | -- | |
| Weiler Richard | $87,700 | -- |
Source: Public Records
Mortgage History
| Date | Status | Borrower | Loan Amount |
|---|---|---|---|
| Previous Owner | Jordan Copeland | $115,900 | |
| Previous Owner | Weiler Richard | $86,491 |
Source: Public Records
Tax History Compared to Growth
Tax History
| Year | Tax Paid | Tax Assessment Tax Assessment Total Assessment is a certain percentage of the fair market value that is determined by local assessors to be the total taxable value of land and additions on the property. | Land | Improvement |
|---|---|---|---|---|
| 2025 | $832 | $98,388 | $34,000 | $64,388 |
| 2024 | $832 | $98,388 | $34,000 | $64,388 |
| 2023 | $832 | $98,388 | $34,000 | $64,388 |
| 2022 | $656 | $77,580 | $18,000 | $59,580 |
| 2021 | $452 | $52,628 | $18,000 | $34,628 |
| 2020 | $452 | $52,628 | $18,000 | $34,628 |
| 2019 | $411 | $47,836 | $16,000 | $31,836 |
| 2018 | $411 | $47,836 | $16,000 | $31,836 |
| 2017 | $219 | $31,720 | $8,000 | $23,720 |
| 2016 | $177 | $25,656 | $4,000 | $21,656 |
| 2015 | $192 | $25,656 | $4,000 | $21,656 |
| 2014 | $124 | $15,952 | $0 | $0 |
Source: Public Records
Map
Nearby Homes
- 560 Manning Rd SW
- 594 Manning Rd SW
- 199 Hickory Walk SW
- 207 Westland Cir SW
- 1161 Rockmann Terrace SW
- 332 Rockmann Ln SW
- 106 Westland Ct SW
- 920 Westland Dr SW
- 839 Manning Villas Ct SW
- 260 Manning Rd SW Unit 110
- 181 Brighton Ct SW
- 834 Cannon Run SW
- 838 Cannon Run SW
- 1141 Whitlock Ave NW
- 873 Cavalry Dr SW
- 798 Sentinel Ridge SW
- 1047 Chestnut Hill Cir SW
- 564 Manning Rd SW Unit 564
- 564 Manning Rd SW
- 566 Manning Rd SW
- 562 Manning Rd SW
- 562 Manning Rd SW Unit 562
- 568 Manning Rd SW
- 560 Manning Rd SW Unit 560
- 558 Manning Rd SW
- 570 Manning Rd SW
- 570 Manning Rd SW
- 572 Manning Rd SW
- 157 Kimberly Way SW Unit 159
- 153 Kimberly Way SW Unit 155
- 574 Manning Rd SW
- 161 Kimberly Way SW
- 576 Manning Rd SW
- 576 Manning Rd SW
- 149 Kimberly Way SW Unit 151
- 578 Manning Rd SW
- 578 Manning Rd SW