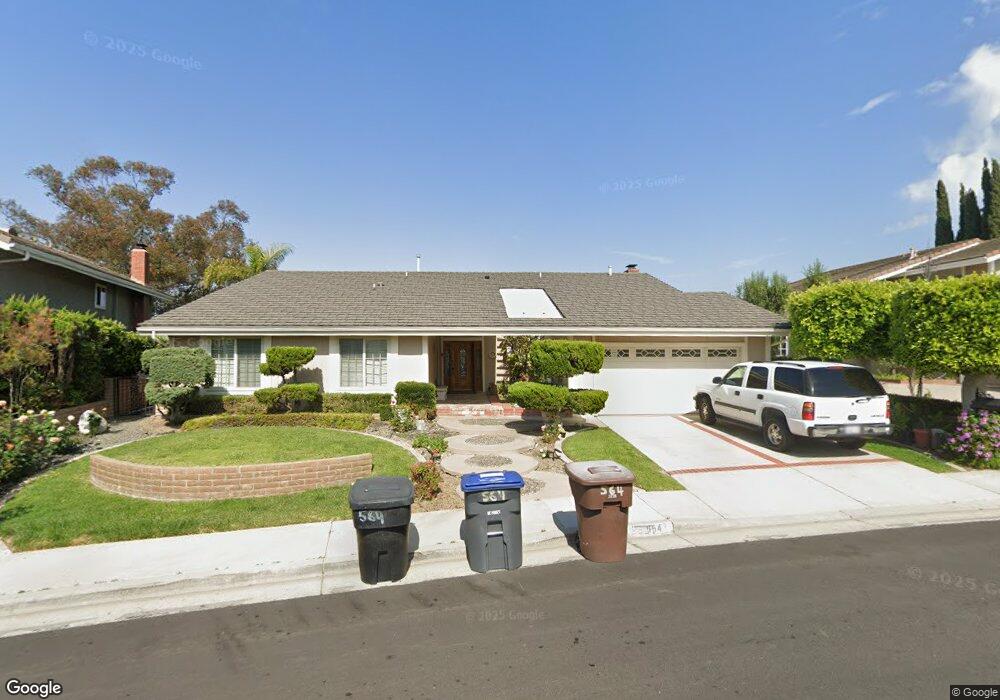
564 S Silverado Way Anaheim, CA 92807
Anaheim Hills NeighborhoodEstimated Value: $1,527,000 - $1,718,000
4
Beds
3
Baths
2,219
Sq Ft
$729/Sq Ft
Est. Value
About This Home
This home is located at 564 S Silverado Way, Anaheim, CA 92807 and is currently estimated at $1,618,581, approximately $729 per square foot. 564 S Silverado Way is a home located in Orange County with nearby schools including Imperial Elementary School, Canyon High School, and El Rancho Charter.
Ownership History
Date
Name
Owned For
Owner Type
Purchase Details
Closed on
Nov 15, 2011
Sold by
Fernando Edwin
Bought by
Fernando Evelynne C
Current Estimated Value
Purchase Details
Closed on
Sep 9, 2010
Sold by
Fernando Edwin
Bought by
Fernando Edwin and Fernando Evelynne C
Purchase Details
Closed on
Jan 27, 2010
Sold by
Fernando Evelynne C
Bought by
Fernando Edwin
Home Financials for this Owner
Home Financials are based on the most recent Mortgage that was taken out on this home.
Original Mortgage
$552,000
Interest Rate
4.25%
Mortgage Type
New Conventional
Purchase Details
Closed on
Dec 18, 2009
Sold by
Keneipp William E and Keneipp Barbara G
Bought by
Fernando Edwin
Home Financials for this Owner
Home Financials are based on the most recent Mortgage that was taken out on this home.
Original Mortgage
$552,000
Interest Rate
4.25%
Mortgage Type
New Conventional
Create a Home Valuation Report for This Property
The Home Valuation Report is an in-depth analysis detailing your home's value as well as a comparison with similar homes in the area
Home Values in the Area
Average Home Value in this Area
Purchase History
| Date | Buyer | Sale Price | Title Company |
|---|---|---|---|
| Fernando Evelynne C | -- | None Available | |
| Fernando Edwin | -- | None Available | |
| Fernando Edwin | -- | Fidelity National Title Co | |
| Fernando Edwin | $690,000 | Fidelity National Title Co |
Source: Public Records
Mortgage History
| Date | Status | Borrower | Loan Amount |
|---|---|---|---|
| Closed | Fernando Edwin | $552,000 |
Source: Public Records
Tax History Compared to Growth
Tax History
| Year | Tax Paid | Tax Assessment Tax Assessment Total Assessment is a certain percentage of the fair market value that is determined by local assessors to be the total taxable value of land and additions on the property. | Land | Improvement |
|---|---|---|---|---|
| 2025 | $9,549 | $890,659 | $706,121 | $184,538 |
| 2024 | $9,549 | $873,196 | $692,276 | $180,920 |
| 2023 | $9,339 | $856,075 | $678,702 | $177,373 |
| 2022 | $9,158 | $839,290 | $665,394 | $173,896 |
| 2021 | $8,900 | $822,834 | $652,347 | $170,487 |
| 2020 | $8,817 | $814,397 | $645,658 | $168,739 |
| 2019 | $8,703 | $798,429 | $632,998 | $165,431 |
| 2018 | $8,569 | $782,774 | $620,586 | $162,188 |
| 2017 | $8,208 | $767,426 | $608,418 | $159,008 |
| 2016 | $8,048 | $752,379 | $596,488 | $155,891 |
| 2015 | $7,943 | $741,078 | $587,528 | $153,550 |
| 2014 | $7,405 | $690,910 | $546,865 | $144,045 |
Source: Public Records
Map
Nearby Homes
- 5291 E Rural Ridge Cir
- 5409 E Willowick Cir
- 5353 E Rural Ridge Cir
- 420 S Rolling Hills Place
- 4823 E Ashford Ave
- 5130 E Henley Place Unit A
- 580 S Londerry Ln
- 5470 E Big Sky Ln
- 595 S Avenida Faro
- 463 S Westridge Cir
- 346 S Silverbrook Dr
- 2811 N Roxbury St
- 581 S Paseo Carmel
- 480 S Avenida Faro
- 5742 E Hudson Bay Dr
- 4330 E Cornwall Ave
- 5548 E Vista Del Este
- 5540 E Vista Del Este
- 155 S Avenida Felipe
- 230 S Plaza de Domingos
- 568 S Silverado Way
- 560 S Silverado Way
- 572 S Silverado Way
- 565 S Silverado Way
- 561 S Silverado Way
- 556 S Silverado Way
- 554 S Silverado Way
- 571 S Silverado Way
- 574 S Silverado Way
- 575 S Silverado Way
- 573 S Silverado Way
- 5282 E Rural Ridge Cir
- 5280 E Rural Ridge Cir
- 5284 E Rural Ridge Cir
- 550 S Silverado Way
- 5278 E Rural Ridge Cir
- 525 S Tumbleweed Rd
- 5361 E Willowick Dr
- 5351 E Willowick Dr
- 5345 E Willowick Dr