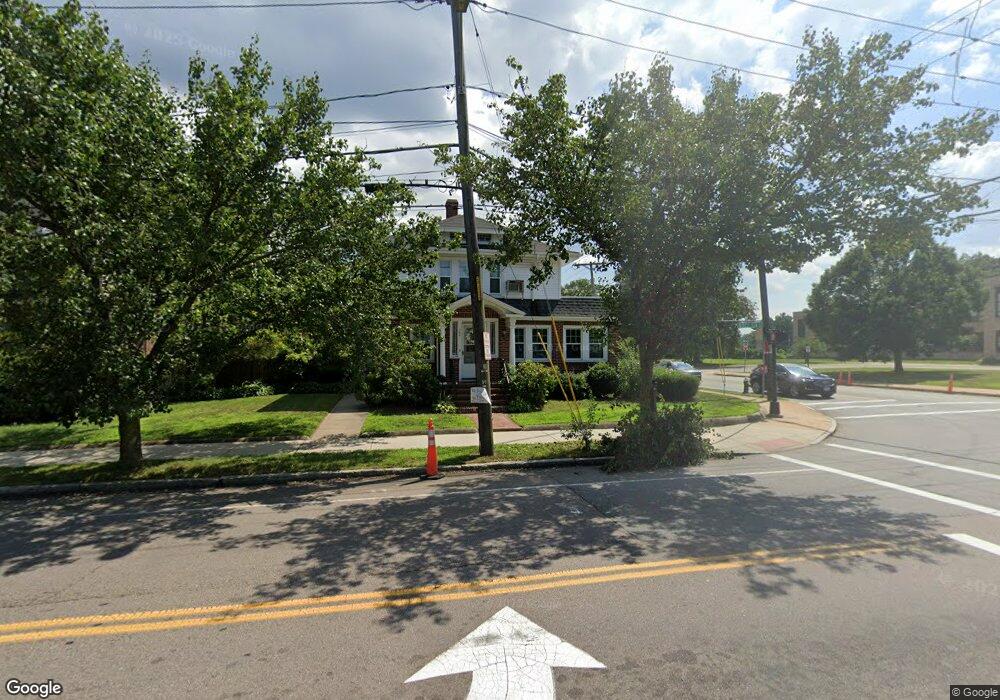
564 W Elm St Brockton, MA 02301
Estimated Value: $552,000 - $691,000
3
Beds
2
Baths
1,840
Sq Ft
$330/Sq Ft
Est. Value
About This Home
This home is located at 564 W Elm St, Brockton, MA 02301 and is currently estimated at $607,978, approximately $330 per square foot. 564 W Elm St is a home located in Plymouth County with nearby schools including Manthala George Jr. School, Hancock Elementary School, and Louis F Angelo Elementary School.
Ownership History
Date
Name
Owned For
Owner Type
Purchase Details
Closed on
Jun 12, 2007
Sold by
Mastr Alternative Loan and Us Bk
Bought by
Brown Beatrice and Brown Norman
Current Estimated Value
Purchase Details
Closed on
Oct 10, 2006
Sold by
Chery Jephthe
Bought by
Mastr Alternative Loan and Us Bk
Purchase Details
Closed on
Jul 10, 2006
Sold by
Melo Octavio
Bought by
Cheryl Jephte
Purchase Details
Closed on
Oct 26, 2005
Sold by
Mello Dev Llc and Melo
Bought by
Chery Jephthe
Purchase Details
Closed on
Mar 17, 2005
Sold by
Spivack Melvin H and Spivack Marilyn P
Bought by
Melo Octavio and Melo Carlos R
Create a Home Valuation Report for This Property
The Home Valuation Report is an in-depth analysis detailing your home's value as well as a comparison with similar homes in the area
Home Values in the Area
Average Home Value in this Area
Purchase History
| Date | Buyer | Sale Price | Title Company |
|---|---|---|---|
| Brown Beatrice | $245,000 | -- | |
| Mastr Alternative Loan | $283,460 | -- | |
| Cheryl Jephte | -- | -- | |
| Chery Jephthe | $335,000 | -- | |
| Melo Octavio | $280,000 | -- |
Source: Public Records
Mortgage History
| Date | Status | Borrower | Loan Amount |
|---|---|---|---|
| Open | Melo Octavio | $216,000 |
Source: Public Records
Tax History Compared to Growth
Tax History
| Year | Tax Paid | Tax Assessment Tax Assessment Total Assessment is a certain percentage of the fair market value that is determined by local assessors to be the total taxable value of land and additions on the property. | Land | Improvement |
|---|---|---|---|---|
| 2025 | $6,457 | $533,200 | $144,200 | $389,000 |
| 2024 | $6,044 | $502,800 | $144,200 | $358,600 |
| 2023 | $5,605 | $431,800 | $108,900 | $322,900 |
| 2022 | $5,406 | $387,000 | $98,900 | $288,100 |
| 2021 | $5,097 | $351,500 | $91,800 | $259,700 |
| 2020 | $3 | $336,100 | $88,100 | $248,000 |
| 2019 | $4,886 | $314,400 | $81,700 | $232,700 |
| 2018 | $4,683 | $291,600 | $81,700 | $209,900 |
| 2017 | $3 | $278,300 | $81,700 | $196,600 |
| 2016 | $4,930 | $284,000 | $77,900 | $206,100 |
| 2015 | $4,450 | $245,200 | $77,900 | $167,300 |
| 2014 | $4,353 | $240,100 | $77,900 | $162,200 |
Source: Public Records
Map
Nearby Homes