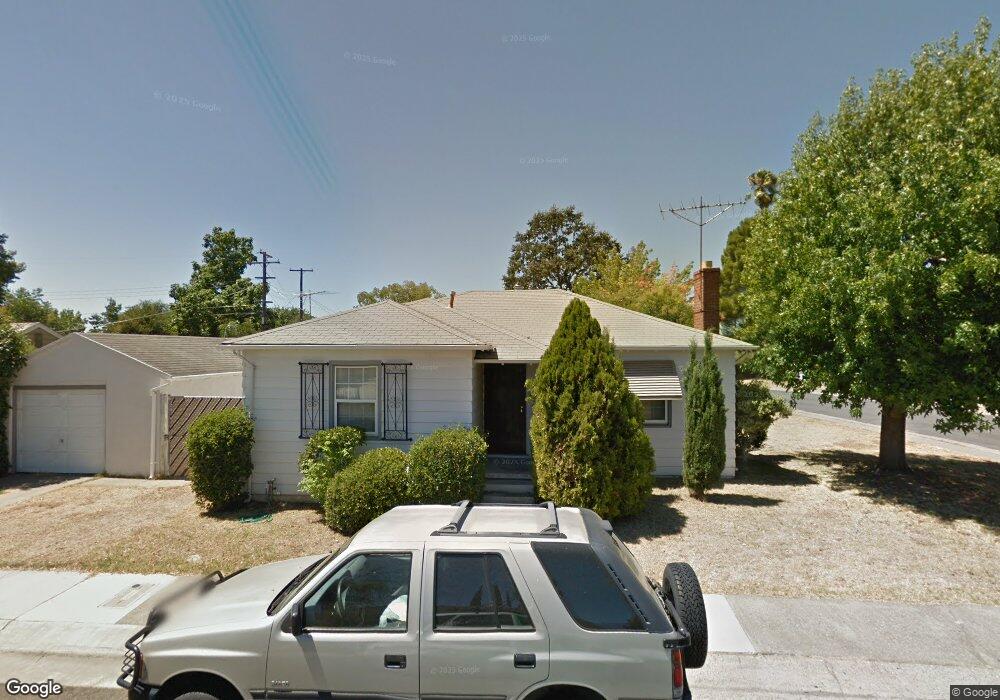
5640 Velma Way Sacramento, CA 95824
Fruitridge Manor NeighborhoodEstimated Value: $278,000 - $388,000
2
Beds
1
Bath
955
Sq Ft
$345/Sq Ft
Est. Value
About This Home
This home is located at 5640 Velma Way, Sacramento, CA 95824 and is currently estimated at $329,224, approximately $344 per square foot. 5640 Velma Way is a home located in Sacramento County with nearby schools including Suy:u Elementary School, Will C. Wood Middle School, and Hiram W. Johnson High School.
Ownership History
Date
Name
Owned For
Owner Type
Purchase Details
Closed on
Apr 7, 1999
Sold by
Hud
Bought by
Calvan Froilan C
Current Estimated Value
Home Financials for this Owner
Home Financials are based on the most recent Mortgage that was taken out on this home.
Original Mortgage
$69,018
Outstanding Balance
$17,288
Interest Rate
6.91%
Mortgage Type
FHA
Estimated Equity
$311,936
Purchase Details
Closed on
Aug 13, 1998
Sold by
Harris Mildred T
Bought by
Countrywide Home Loans Inc
Purchase Details
Closed on
Apr 21, 1998
Sold by
Countrywide Home Loans Inc
Bought by
Hud
Purchase Details
Closed on
Jul 6, 1994
Sold by
Burkhart Darrell B
Bought by
Harris Mildred T
Home Financials for this Owner
Home Financials are based on the most recent Mortgage that was taken out on this home.
Original Mortgage
$76,585
Interest Rate
8.53%
Mortgage Type
FHA
Create a Home Valuation Report for This Property
The Home Valuation Report is an in-depth analysis detailing your home's value as well as a comparison with similar homes in the area
Home Values in the Area
Average Home Value in this Area
Purchase History
| Date | Buyer | Sale Price | Title Company |
|---|---|---|---|
| Calvan Froilan C | $68,000 | Stewart Title | |
| Countrywide Home Loans Inc | $79,244 | First American Title Ins Co | |
| Hud | -- | First American Title Ins Co | |
| Harris Mildred T | $4,272 | Placer Title Company |
Source: Public Records
Mortgage History
| Date | Status | Borrower | Loan Amount |
|---|---|---|---|
| Open | Calvan Froilan C | $69,018 | |
| Previous Owner | Harris Mildred T | $76,585 |
Source: Public Records
Tax History Compared to Growth
Tax History
| Year | Tax Paid | Tax Assessment Tax Assessment Total Assessment is a certain percentage of the fair market value that is determined by local assessors to be the total taxable value of land and additions on the property. | Land | Improvement |
|---|---|---|---|---|
| 2025 | $1,392 | $106,574 | $34,003 | $72,571 |
| 2024 | $1,392 | $104,486 | $33,337 | $71,149 |
| 2023 | $1,358 | $102,438 | $32,684 | $69,754 |
| 2022 | $1,334 | $100,431 | $32,044 | $68,387 |
| 2021 | $1,273 | $98,463 | $31,416 | $67,047 |
| 2020 | $1,280 | $97,454 | $31,094 | $66,360 |
| 2019 | $1,253 | $95,544 | $30,485 | $65,059 |
| 2018 | $1,221 | $93,672 | $29,888 | $63,784 |
| 2017 | $1,203 | $91,836 | $29,302 | $62,534 |
| 2016 | $1,154 | $90,036 | $28,728 | $61,308 |
| 2015 | $1,136 | $88,685 | $28,297 | $60,388 |
| 2014 | $1,108 | $86,949 | $27,743 | $59,206 |
Source: Public Records
Map
Nearby Homes
- 7928 35th Ave
- 5532 Fruitridge Rd
- 5841 35th Ave
- 5640 Fruitridge Rd
- 5639 59th St
- 5501 59th St
- 5352 Young St
- 5341 Young St
- 5413 61st St
- 5219 Thurman Way
- 5823 61st St
- 5210 61st St
- 5101 Esmeralda St
- 5218 Thurman Way
- 5749 Nina Way
- 6060 Mcmahon Dr
- 5561 48th St
- 5380 49th St
- 5004 Argo Way
- 5940 Lemon Park Way