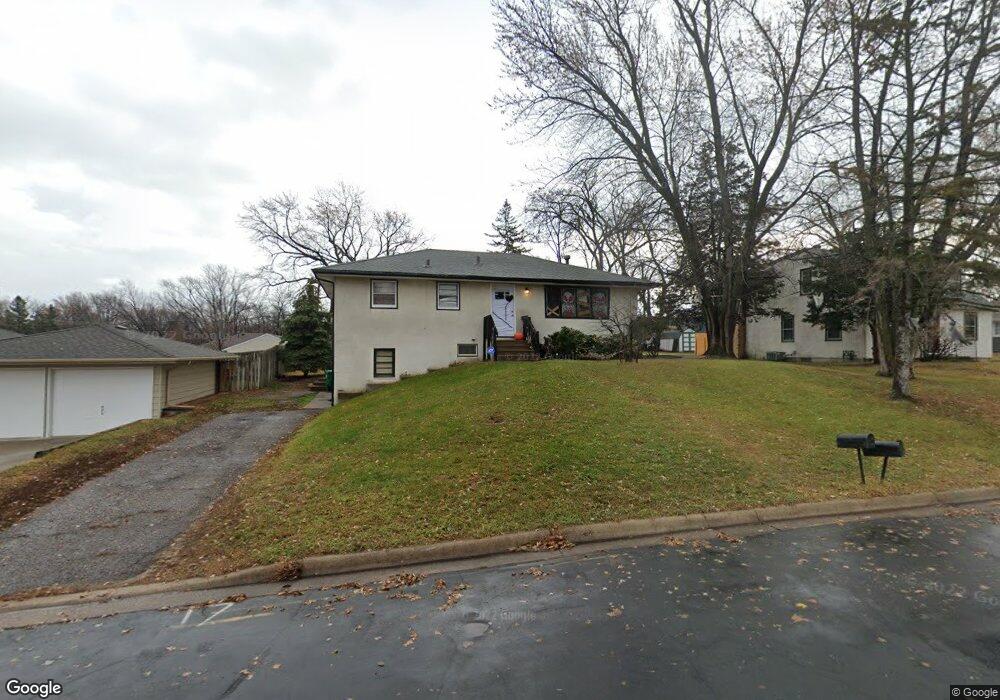
5641 4th St NE Minneapolis, MN 55432
Bonny NeighborhoodEstimated Value: $316,000 - $393,000
4
Beds
2
Baths
1,575
Sq Ft
$220/Sq Ft
Est. Value
About This Home
This home is located at 5641 4th St NE, Minneapolis, MN 55432 and is currently estimated at $346,052, approximately $219 per square foot. 5641 4th St NE is a home located in Anoka County with nearby schools including Stevenson Elementary School, Fridley Middle School, and Fridley Senior High School.
Ownership History
Date
Name
Owned For
Owner Type
Purchase Details
Closed on
Jun 16, 2022
Sold by
Dg Equities Llc
Bought by
Vang Mai and Lopez Omar
Current Estimated Value
Home Financials for this Owner
Home Financials are based on the most recent Mortgage that was taken out on this home.
Original Mortgage
$335,968
Outstanding Balance
$319,675
Interest Rate
5.27%
Mortgage Type
New Conventional
Estimated Equity
$26,377
Purchase Details
Closed on
Dec 21, 2012
Sold by
Hhw Properties Inc
Bought by
Ylhhw Properties
Purchase Details
Closed on
May 2, 2011
Sold by
Federal Home Loan
Bought by
Hhw Properties Inc
Purchase Details
Closed on
May 31, 2001
Sold by
Urgiles Jose and Cardenas Germania T
Bought by
Banham Tamrah A
Purchase Details
Closed on
Oct 30, 2000
Sold by
Johnson Mury
Bought by
Urgiles Jose and Cardenas Germania T
Purchase Details
Closed on
Aug 4, 1998
Sold by
Okeefe Peter P and Okeefe Christine M
Bought by
Johnson Mury
Create a Home Valuation Report for This Property
The Home Valuation Report is an in-depth analysis detailing your home's value as well as a comparison with similar homes in the area
Home Values in the Area
Average Home Value in this Area
Purchase History
| Date | Buyer | Sale Price | Title Company |
|---|---|---|---|
| Vang Mai | $360,800 | -- | |
| Ylhhw Properties | -- | None Available | |
| Hhw Properties Inc | $76,000 | -- | |
| Banham Tamrah A | $177,000 | -- | |
| Urgiles Jose | $154,900 | -- | |
| Johnson Mury | $89,500 | -- |
Source: Public Records
Mortgage History
| Date | Status | Borrower | Loan Amount |
|---|---|---|---|
| Open | Vang Mai | $335,968 |
Source: Public Records
Tax History Compared to Growth
Tax History
| Year | Tax Paid | Tax Assessment Tax Assessment Total Assessment is a certain percentage of the fair market value that is determined by local assessors to be the total taxable value of land and additions on the property. | Land | Improvement |
|---|---|---|---|---|
| 2025 | $4,646 | $333,700 | $99,600 | $234,100 |
| 2024 | $4,646 | $340,200 | $76,400 | $263,800 |
| 2023 | $4,482 | $341,900 | $81,300 | $260,600 |
| 2022 | $4,204 | $293,200 | $55,400 | $237,800 |
| 2021 | $4,086 | $226,700 | $56,100 | $170,600 |
| 2020 | $3,430 | $226,700 | $49,500 | $177,200 |
| 2019 | $3,007 | $222,300 | $51,800 | $170,500 |
| 2018 | $2,588 | $194,600 | $0 | $0 |
| 2017 | $2,426 | $160,700 | $0 | $0 |
| 2016 | $2,321 | $138,800 | $0 | $0 |
| 2015 | $2,225 | $138,800 | $33,200 | $105,600 |
| 2014 | -- | $115,500 | $26,800 | $88,700 |
Source: Public Records
Map
Nearby Homes
- 5724 4th St NE
- 5751 7th St NE
- 5820 2 1 2 St NE
- 610 57th Ave NE
- 655 57th Ave NE
- 650 58th Ave NE
- 5724 W Moore Lake Dr NE
- 5207 7th St NE
- 6120 7th St NE
- 613 Sullivan Dr NE
- 5730 Polk St NE
- 6231 Trinity Dr NE
- 5006 6th St NE
- 261 Sylvan Ln NE
- 524 63rd Ave NE
- 6231 Starlite Blvd NE
- 5000 Washington St NE
- 4928 4th St NE
- 6220 Carol Dr NE
- 211 Christenson Way NE
- 5617 4th St NE
- 5647 4th St NE
- 5643 4th St NE
- 5618 5th St NE
- 5626 5th St NE
- 5616 4th St NE
- 5622 4th St NE
- 5638 5th St NE
- 5614 4th St NE
- 5648 5th St NE
- 5614 5th St NE
- 5615 4th St NE
- 5612 5th St NE
- 5610 4th St NE
- 5613 4th St NE
- 360 57th Ave NE
- 5649 University Ave NE
- 5702 4th St NE
- 5608 5th St NE
- 5608 4th St NE