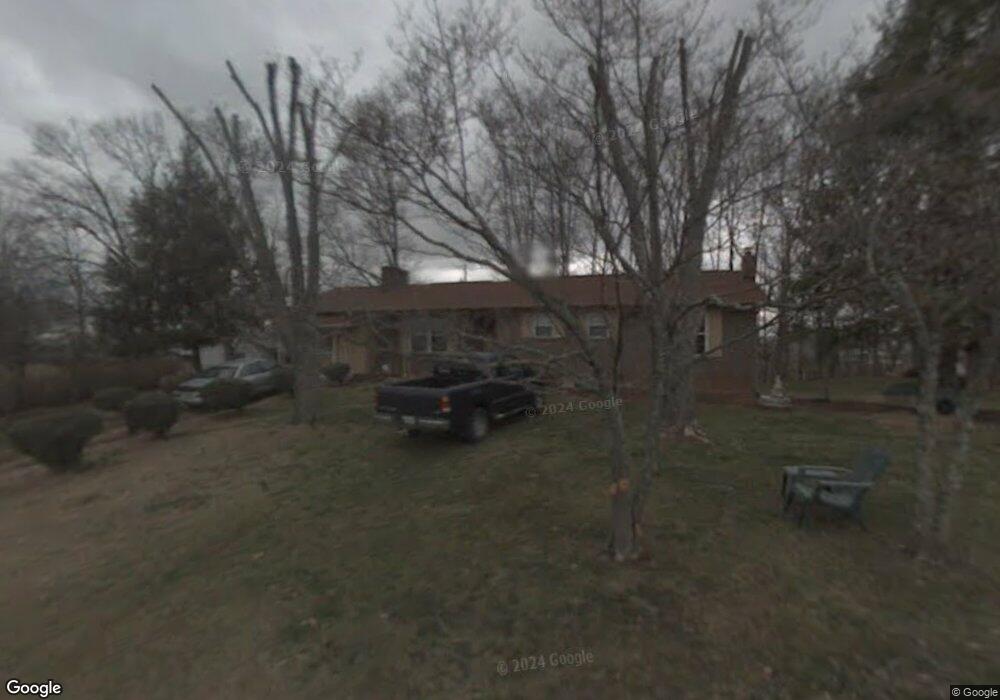
5641 Myers Rd Russellville, TN 37860
Estimated Value: $255,000 - $328,000
3
Beds
2
Baths
1,547
Sq Ft
$188/Sq Ft
Est. Value
About This Home
This home is located at 5641 Myers Rd, Russellville, TN 37860 and is currently estimated at $291,605, approximately $188 per square foot. 5641 Myers Rd is a home located in Hamblen County with nearby schools including Russellville Elementary School, East Ridge Middle School, and Morristown East High School.
Ownership History
Date
Name
Owned For
Owner Type
Purchase Details
Closed on
Oct 16, 2018
Sold by
Schaar David and Ciccone Brenda
Bought by
Gillen Daniel R and Gillen Toni
Current Estimated Value
Home Financials for this Owner
Home Financials are based on the most recent Mortgage that was taken out on this home.
Original Mortgage
$100,000
Outstanding Balance
$87,206
Interest Rate
4.5%
Mortgage Type
New Conventional
Estimated Equity
$204,399
Purchase Details
Closed on
Feb 24, 2013
Sold by
Schaar Janice and Schaar Schaar
Bought by
Schaar David and Ciccone Brenda
Purchase Details
Closed on
Nov 13, 2009
Sold by
Myers Jerald Wayne
Bought by
Schaar Janice
Purchase Details
Closed on
Nov 10, 2009
Sold by
Myers Jerald Wayne
Bought by
Lukovics Paul A
Purchase Details
Closed on
Oct 29, 2009
Sold by
Myers Jerald Wayne
Bought by
Susong Michael
Purchase Details
Closed on
Aug 5, 2003
Sold by
Myers D K
Bought by
Myers Jerald W
Purchase Details
Closed on
Aug 4, 1971
Bought by
Myers Myers D and Myers Gladys
Create a Home Valuation Report for This Property
The Home Valuation Report is an in-depth analysis detailing your home's value as well as a comparison with similar homes in the area
Home Values in the Area
Average Home Value in this Area
Purchase History
| Date | Buyer | Sale Price | Title Company |
|---|---|---|---|
| Gillen Daniel R | $153,000 | None Available | |
| Schaar David | -- | -- | |
| Schaar Janice | $94,600 | -- | |
| Lukovics Paul A | $39,600 | -- | |
| Susong Michael | $24,750 | -- | |
| Brewer Juanita | $35,200 | -- | |
| Myers Jerald W | -- | -- | |
| Myers Myers D | -- | -- |
Source: Public Records
Mortgage History
| Date | Status | Borrower | Loan Amount |
|---|---|---|---|
| Open | Gillen Daniel R | $100,000 |
Source: Public Records
Tax History Compared to Growth
Tax History
| Year | Tax Paid | Tax Assessment Tax Assessment Total Assessment is a certain percentage of the fair market value that is determined by local assessors to be the total taxable value of land and additions on the property. | Land | Improvement |
|---|---|---|---|---|
| 2024 | $589 | $29,875 | $4,050 | $25,825 |
| 2023 | $589 | $29,875 | $0 | $0 |
| 2022 | $589 | $29,875 | $4,050 | $25,825 |
| 2021 | $589 | $29,875 | $4,050 | $25,825 |
| 2020 | $578 | $29,875 | $4,050 | $25,825 |
| 2019 | $512 | $24,050 | $3,475 | $20,575 |
| 2018 | $512 | $24,050 | $3,475 | $20,575 |
| 2017 | $512 | $24,050 | $3,475 | $20,575 |
| 2016 | $479 | $24,050 | $3,475 | $20,575 |
| 2015 | $445 | $24,050 | $3,475 | $20,575 |
| 2014 | -- | $24,050 | $3,475 | $20,575 |
| 2013 | -- | $28,600 | $0 | $0 |
Source: Public Records
Map
Nearby Homes
- 770 Harvey Dr
- 505 Mary St
- 1607 Weatherby Ct
- 5659 Browning Way
- 354 Volunteer Dr
- 233 Harvey Dr
- 5085 Old Kentucky Rd
- 5556 Denton Dr
- 1708 Boardwalk Cir
- 5740 Dodson Ferry Rd
- 5790 N 2nd St
- 5110 Anne Cir
- 4475 Copeland Dr
- 2551 Cedar Creek Rd
- 4561 Birchwood Cir
- 6284 Old Russellville Pike
- 5601 Brights Pike
- 6330 Old Russellville Pike
- 2145 Fall Creek Rd
- 6421 Old Russellville Pike