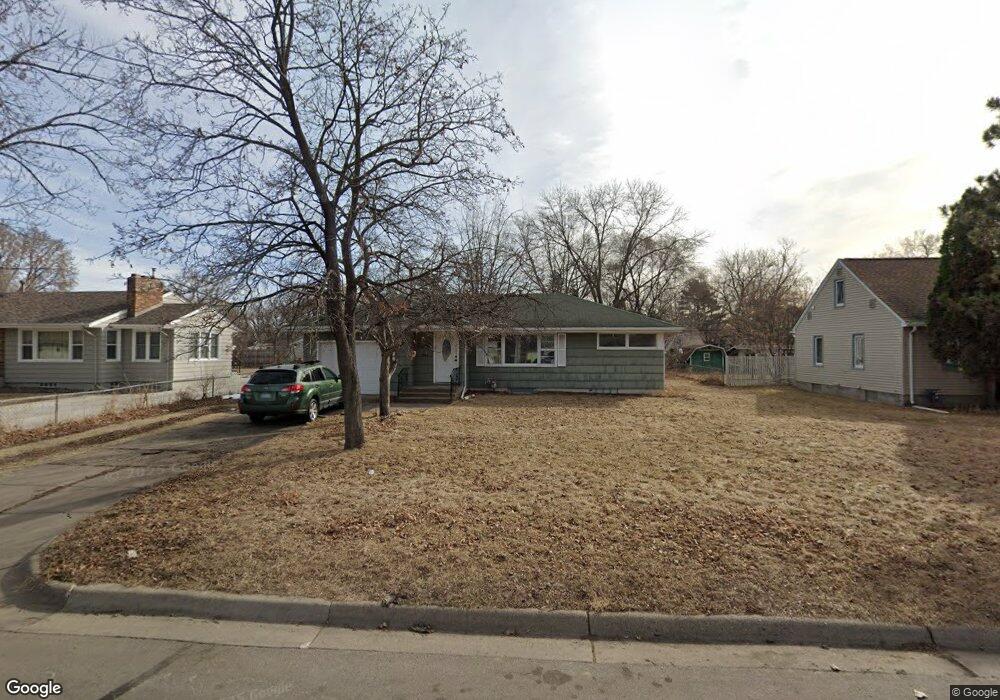
5642 Dupont Ave N Minneapolis, MN 55430
Bellvue NeighborhoodEstimated Value: $271,000 - $301,678
4
Beds
2
Baths
996
Sq Ft
$285/Sq Ft
Est. Value
About This Home
This home is located at 5642 Dupont Ave N, Minneapolis, MN 55430 and is currently estimated at $283,670, approximately $284 per square foot. 5642 Dupont Ave N is a home located in Hennepin County with nearby schools including Brooklyn Center Elementary STEAM, Bright Water MontessoriSchool, and KIPP North Star Primary.
Ownership History
Date
Name
Owned For
Owner Type
Purchase Details
Closed on
Jul 18, 2016
Sold by
Cosco Property 5 Llc
Bought by
Veit Enjoli L
Current Estimated Value
Home Financials for this Owner
Home Financials are based on the most recent Mortgage that was taken out on this home.
Original Mortgage
$216,558
Outstanding Balance
$172,187
Interest Rate
3.54%
Mortgage Type
VA
Estimated Equity
$111,483
Purchase Details
Closed on
Oct 9, 2015
Sold by
Beneficial Loan & Thrift Co
Bought by
Cosco Property 5 Llc
Purchase Details
Closed on
Jan 5, 2015
Sold by
Maass Roxanne D
Bought by
Beneficial Loan & Thrift Co
Purchase Details
Closed on
Jun 19, 2000
Sold by
Conger Christopher D and Maass Roberta L
Bought by
Maass Roxanne D
Purchase Details
Closed on
Nov 30, 1998
Sold by
Conger Christopher D and Maass Roberta L
Bought by
Maass Roxanne D
Create a Home Valuation Report for This Property
The Home Valuation Report is an in-depth analysis detailing your home's value as well as a comparison with similar homes in the area
Home Values in the Area
Average Home Value in this Area
Purchase History
| Date | Buyer | Sale Price | Title Company |
|---|---|---|---|
| Veit Enjoli L | $212,000 | Burnet Title | |
| Cosco Property 5 Llc | $96,300 | Attorney | |
| Beneficial Loan & Thrift Co | $104,400 | None Available | |
| Maass Roxanne D | $77,000 | -- | |
| Maass Roxanne D | $77,000 | -- |
Source: Public Records
Mortgage History
| Date | Status | Borrower | Loan Amount |
|---|---|---|---|
| Open | Veit Enjoli L | $216,558 | |
| Closed | Maass Roxanne D | -- |
Source: Public Records
Tax History Compared to Growth
Tax History
| Year | Tax Paid | Tax Assessment Tax Assessment Total Assessment is a certain percentage of the fair market value that is determined by local assessors to be the total taxable value of land and additions on the property. | Land | Improvement |
|---|---|---|---|---|
| 2024 | $4,302 | $271,000 | $67,000 | $204,000 |
| 2023 | $4,087 | $260,700 | $55,000 | $205,700 |
| 2022 | $4,283 | $258,000 | $61,000 | $197,000 |
| 2021 | $4,310 | $222,000 | $51,000 | $171,000 |
| 2020 | $3,716 | $214,000 | $48,000 | $166,000 |
| 2019 | $3,676 | $199,000 | $41,000 | $158,000 |
| 2018 | $2,918 | $202,000 | $50,000 | $152,000 |
| 2017 | $2,278 | $150,000 | $35,000 | $115,000 |
| 2016 | $3,924 | $147,600 | $40,000 | $107,600 |
| 2015 | $2,988 | $136,500 | $35,900 | $100,600 |
| 2014 | -- | $110,700 | $34,400 | $76,300 |
Source: Public Records
Map
Nearby Homes
- 1107 57th Ave N
- 5654 Bryant Ave N
- 810 57th Ave N
- 5513 Bryant Ave N
- 5527 Fremont Ave N
- 5818 Emerson Ave N
- 5524 Humboldt Ave N
- 5447 N 4th St
- 5716 James Ave N
- 5929 Camden Ave N
- 6006 Bryant Ave N
- 5819 Knox Ave N
- 5238 Fremont Ave N
- 5239 N 6th St
- 5200 Aldrich Ave N
- 2017 Brookview Dr
- 6518 W River Rd
- 5247 James Ave N
- 5121 Aldrich Ave N
- 5050 Emerson Ave N
- 5636 Dupont Ave N
- 5643 Colfax Ave N
- 5630 Dupont Ave N
- 5637 Colfax Ave N
- 5649 Colfax Ave N
- 5641 Dupont Ave N
- 5631 Colfax Ave N
- 5651 Dupont Ave N
- 5635 Dupont Ave N
- 5700 Dupont Ave N
- 5624 Dupont Ave N
- 1000 57th Ave N
- 5623 Colfax Ave N
- 5625 Dupont Ave N
- 1100 57th Ave N
- 5616 Dupont Ave N
- 5707 Colfax Ave N
- 5615 Colfax Ave N
- 5642 Emerson Ave N
- 5638 Colfax Ave N