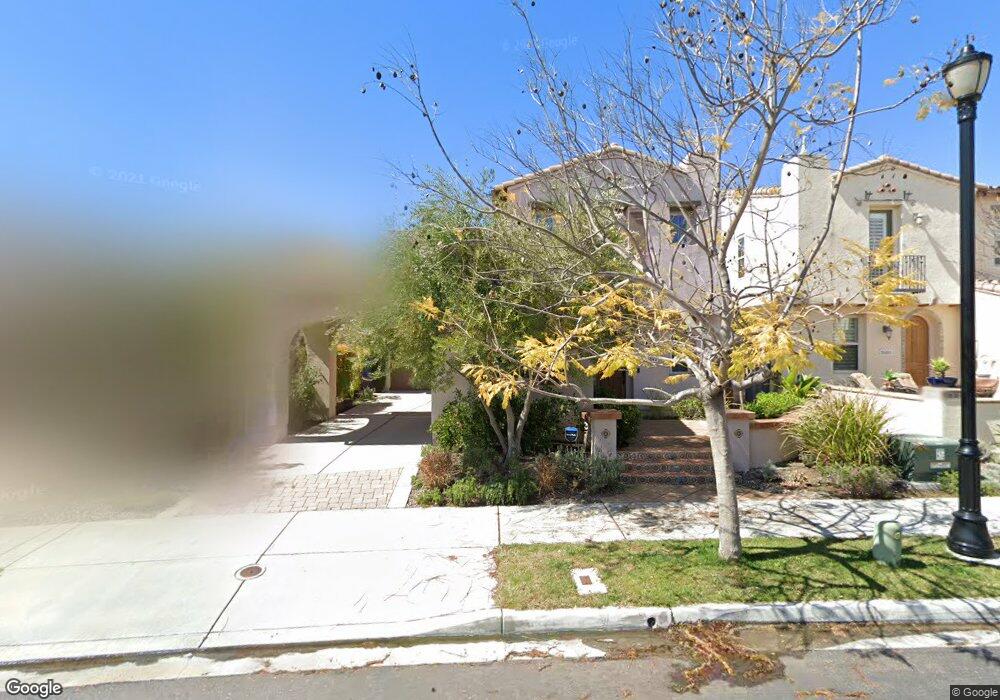
5642 Painted Nettles Glen San Diego, CA 92130
Carmel Valley NeighborhoodEstimated Value: $1,972,844 - $2,122,000
4
Beds
3
Baths
2,056
Sq Ft
$991/Sq Ft
Est. Value
About This Home
This home is located at 5642 Painted Nettles Glen, San Diego, CA 92130 and is currently estimated at $2,036,961, approximately $990 per square foot. 5642 Painted Nettles Glen is a home located in San Diego County with nearby schools including Sycamore Ridge, Pacific Trails Middle, and Torrey Pines High School.
Ownership History
Date
Name
Owned For
Owner Type
Purchase Details
Closed on
Feb 15, 2019
Sold by
Kabkeo Julien Bruno Bernard and Kabkeo Julien
Bought by
Breen Church Jeremy J H and Breen Church Kellie
Current Estimated Value
Home Financials for this Owner
Home Financials are based on the most recent Mortgage that was taken out on this home.
Original Mortgage
$920,000
Outstanding Balance
$807,195
Interest Rate
4.4%
Mortgage Type
New Conventional
Estimated Equity
$1,229,766
Purchase Details
Closed on
Aug 30, 2010
Sold by
Tran Juliann Quynh
Bought by
Jullien Bruno Bernard and Jullien Kabkeo
Home Financials for this Owner
Home Financials are based on the most recent Mortgage that was taken out on this home.
Original Mortgage
$581,000
Interest Rate
4.25%
Mortgage Type
New Conventional
Purchase Details
Closed on
Jun 19, 2007
Sold by
Pardee Homes
Bought by
Tran Juliann Quynh
Home Financials for this Owner
Home Financials are based on the most recent Mortgage that was taken out on this home.
Original Mortgage
$689,882
Interest Rate
6.21%
Mortgage Type
Purchase Money Mortgage
Create a Home Valuation Report for This Property
The Home Valuation Report is an in-depth analysis detailing your home's value as well as a comparison with similar homes in the area
Home Values in the Area
Average Home Value in this Area
Purchase History
| Date | Buyer | Sale Price | Title Company |
|---|---|---|---|
| Breen Church Jeremy J H | $1,150,000 | Chicago Title Company | |
| Jullien Bruno Bernard | $830,000 | Fidelity National Title | |
| Tran Juliann Quynh | $862,500 | First American Title Co |
Source: Public Records
Mortgage History
| Date | Status | Borrower | Loan Amount |
|---|---|---|---|
| Open | Breen Church Jeremy J H | $920,000 | |
| Previous Owner | Jullien Bruno Bernard | $581,000 | |
| Previous Owner | Tran Juliann Quynh | $689,882 |
Source: Public Records
Tax History Compared to Growth
Tax History
| Year | Tax Paid | Tax Assessment Tax Assessment Total Assessment is a certain percentage of the fair market value that is determined by local assessors to be the total taxable value of land and additions on the property. | Land | Improvement |
|---|---|---|---|---|
| 2025 | $16,291 | $1,282,842 | $892,413 | $390,429 |
| 2024 | $16,291 | $1,257,689 | $874,915 | $382,774 |
| 2023 | $15,992 | $1,233,029 | $857,760 | $375,269 |
| 2022 | $15,778 | $1,208,853 | $840,942 | $367,911 |
| 2021 | $15,298 | $1,185,151 | $824,453 | $360,698 |
| 2020 | $15,404 | $1,173,000 | $816,000 | $357,000 |
| 2019 | $13,048 | $953,250 | $401,972 | $551,278 |
| 2018 | $12,597 | $934,560 | $394,091 | $540,469 |
| 2017 | $12,443 | $916,236 | $386,364 | $529,872 |
| 2016 | $12,129 | $898,272 | $378,789 | $519,483 |
| 2015 | $12,005 | $884,780 | $373,100 | $511,680 |
| 2014 | $11,843 | $867,449 | $365,792 | $501,657 |
Source: Public Records
Map
Nearby Homes
- 5621 Shasta Daisy Trail
- 13120 Chambord Way
- 13016 Lumen Way
- 12932 Peppergrass Creek Gate Unit 58
- 5480 Valerio Trail
- 13033 Lamia Point Unit 217
- 13032 Alora Point Unit 170
- 6265 Silverbush Creek St
- 13233 Petunia Way
- 13165 Caminito Mendiola
- 13348 Camelia Way
- 6222 Artisan Way
- 5312 Sweetwater Trail
- 5347 Morning Sage Way
- 13441 Banyan Way
- 13563 Chamise Vista Ln
- 6336 Sagebrush Bend Way
- 13625 Winstanley Way
- 13568 Bolero Way
- 4970 Beauchamp Ct
- 5650 Painted Nettles Glen
- 5634 Painted Nettles Glen
- 5658 Painted Nettles Glen
- 5630 Painted Nettles Glen
- 5620 Shasta Daisy Trail
- 5666 Painted Nettles Glen
- 5640 Shasta Daisy Trail
- 5655 Painted Nettles Glen
- 5674 Painted Nettles Glen
- 5659 Painted Nettles Glen
- 5610 Shasta Daisy Trail
- 5667 Painted Nettles Glen
- 5682 Painted Nettles Glen
- 5629 Shasta Daisy Trail
- 5633 Shasta Daisy Trail
- 5625 Shasta Daisy Trail
- 5637 Shasta Daisy Trail Unit 12
- 5673 Painted Nettles Glen
- 5654 Shasta Daisy Trail
- 5641 Shasta Daisy Trail