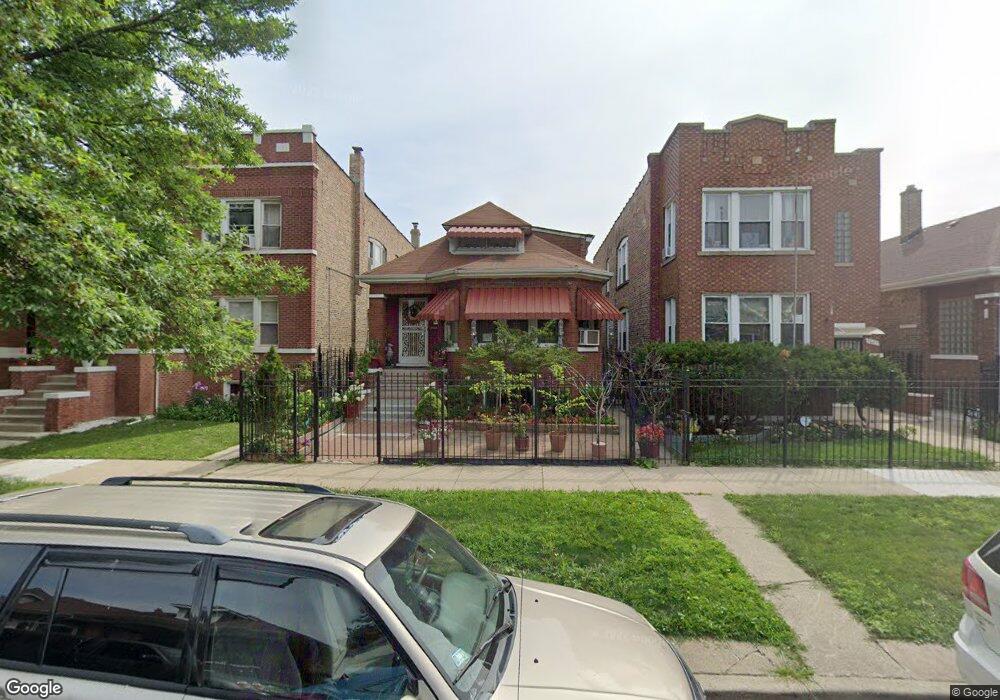
5645 S Campbell Ave Chicago, IL 60629
Gage Park NeighborhoodEstimated Value: $182,000 - $266,000
4
Beds
2
Baths
1,176
Sq Ft
$201/Sq Ft
Est. Value
About This Home
This home is located at 5645 S Campbell Ave, Chicago, IL 60629 and is currently estimated at $236,054, approximately $200 per square foot. 5645 S Campbell Ave is a home located in Cook County with nearby schools including Carson Elementary School, Gage Park High School, and Horizon Science Academy – Southwest Chicago.
Ownership History
Date
Name
Owned For
Owner Type
Purchase Details
Closed on
Jan 14, 2015
Sold by
Jimenez Guilibaldo
Bought by
Orozco Juan P and Orozco Romero Noely Arelys
Current Estimated Value
Home Financials for this Owner
Home Financials are based on the most recent Mortgage that was taken out on this home.
Original Mortgage
$71,250
Outstanding Balance
$56,347
Interest Rate
4.75%
Mortgage Type
New Conventional
Estimated Equity
$179,707
Purchase Details
Closed on
Nov 2, 2011
Sold by
Ayala Maria Paula
Bought by
Jimenez Guilibaldo
Purchase Details
Closed on
Dec 13, 2002
Sold by
Quinones Abel and Quinones Natividad
Bought by
Ayala Tirso and Ayala Maria Paula
Home Financials for this Owner
Home Financials are based on the most recent Mortgage that was taken out on this home.
Original Mortgage
$157,528
Interest Rate
6.3%
Mortgage Type
FHA
Create a Home Valuation Report for This Property
The Home Valuation Report is an in-depth analysis detailing your home's value as well as a comparison with similar homes in the area
Home Values in the Area
Average Home Value in this Area
Purchase History
| Date | Buyer | Sale Price | Title Company |
|---|---|---|---|
| Orozco Juan P | $75,000 | Git | |
| Jimenez Guilibaldo | -- | None Available | |
| Ayala Tirso | $160,000 | Ticor Title Insurance Compan |
Source: Public Records
Mortgage History
| Date | Status | Borrower | Loan Amount |
|---|---|---|---|
| Open | Orozco Juan P | $71,250 | |
| Previous Owner | Ayala Tirso | $157,528 |
Source: Public Records
Tax History Compared to Growth
Tax History
| Year | Tax Paid | Tax Assessment Tax Assessment Total Assessment is a certain percentage of the fair market value that is determined by local assessors to be the total taxable value of land and additions on the property. | Land | Improvement |
|---|---|---|---|---|
| 2024 | $2,903 | $20,000 | $1,815 | $18,185 |
| 2023 | $2,809 | $17,000 | $2,904 | $14,096 |
| 2022 | $2,809 | $17,000 | $2,904 | $14,096 |
| 2021 | $2,749 | $17,000 | $2,904 | $14,096 |
| 2020 | $1,891 | $11,535 | $2,904 | $8,631 |
| 2019 | $1,927 | $12,961 | $2,904 | $10,057 |
| 2018 | $1,894 | $12,961 | $2,904 | $10,057 |
| 2017 | $1,432 | $9,985 | $2,541 | $7,444 |
| 2016 | $2,458 | $12,192 | $2,541 | $9,651 |
| 2015 | $2,250 | $12,192 | $2,541 | $9,651 |
| 2014 | $1,931 | $10,326 | $2,359 | $7,967 |
| 2013 | $1,411 | $10,326 | $2,359 | $7,967 |
Source: Public Records
Map
Nearby Homes
- 2453 W 56th St Unit 1
- 5626 S Maplewood Ave
- 5806 S Talman Ave
- 5730 S Washtenaw Ave
- 5735 S Fairfield Ave
- 5919 S Rockwell St
- 5820 S Washtenaw Ave
- 5950 S Artesian Ave
- 5635 S California Ave
- 5619 S California Ave
- 2208 W 54th Place
- 5931 S Talman Ave
- 5603 S Hamilton Ave
- 5648 S California Ave
- 5544 S California Ave
- 5731 S Hoyne Ave
- 5834 S California Ave
- 5243 S Maplewood Ave
- 6048 S Artesian Ave
- 5247 S Rockwell St
- 5647 S Campbell Ave Unit 1
- 5641 S Campbell Ave Unit 1
- 5641 S Campbell Ave
- 5637 S Campbell Ave
- 5649 S Campbell Ave
- 5633 S Campbell Ave
- 5653 S Campbell Ave
- 5627 S Campbell Ave
- 5655 S Campbell Ave
- 5656 S Artesian Ave
- 5658 S Artesian Ave
- 5652 S Artesian Ave
- 5629 S Campbell Ave
- 5662 S Artesian Ave
- 5650 S Artesian Ave
- 5659 S Campbell Ave
- 5664 S Artesian Ave
- 5625 S Campbell Ave
- 5644 S Artesian Ave
- 5668 S Artesian Ave