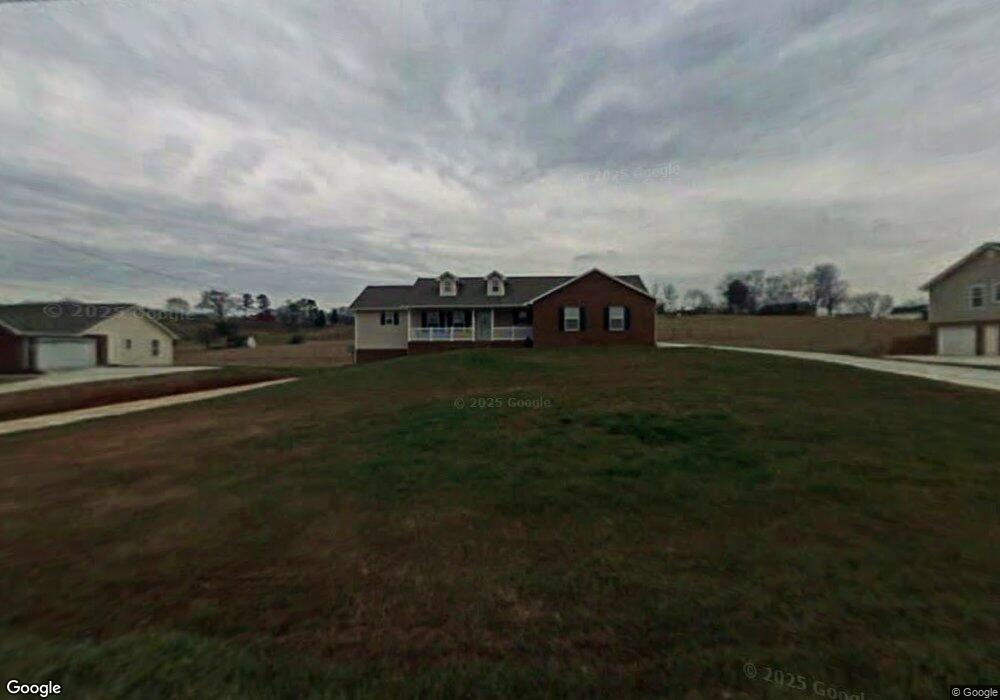
5646 Brights Pike Russellville, TN 37860
Estimated Value: $320,849 - $387,000
--
Bed
2
Baths
1,468
Sq Ft
$242/Sq Ft
Est. Value
About This Home
This home is located at 5646 Brights Pike, Russellville, TN 37860 and is currently estimated at $355,212, approximately $241 per square foot. 5646 Brights Pike is a home located in Hamblen County with nearby schools including Russellville Elementary School, East Ridge Middle School, and Morristown East High School.
Ownership History
Date
Name
Owned For
Owner Type
Purchase Details
Closed on
Nov 30, 2007
Sold by
Lakins Brad
Bought by
Ray Locke Johnny
Current Estimated Value
Home Financials for this Owner
Home Financials are based on the most recent Mortgage that was taken out on this home.
Original Mortgage
$151,350
Outstanding Balance
$95,401
Interest Rate
6.22%
Estimated Equity
$259,811
Purchase Details
Closed on
Mar 5, 2007
Sold by
Locke John Ray
Bought by
Brad Lakins
Purchase Details
Closed on
Feb 5, 2007
Sold by
Lakins William Nicholas
Bought by
Ray Locke John
Purchase Details
Closed on
Jul 7, 2006
Bought by
Lakins William Nicholas and Lakins Brad
Purchase Details
Closed on
Jul 10, 2002
Bought by
Cedar Creek Properties
Purchase Details
Closed on
Mar 1, 1990
Bought by
Buchanan Eddie Wayne
Purchase Details
Closed on
Jul 7, 1978
Bought by
Buchanan Ray and Buchanan Ollie
Purchase Details
Closed on
Jun 12, 1978
Create a Home Valuation Report for This Property
The Home Valuation Report is an in-depth analysis detailing your home's value as well as a comparison with similar homes in the area
Home Values in the Area
Average Home Value in this Area
Purchase History
| Date | Buyer | Sale Price | Title Company |
|---|---|---|---|
| Ray Locke Johnny | $151,350 | -- | |
| Brad Lakins | $17,000 | -- | |
| Ray Locke John | $22,000 | -- | |
| Lakins William Nicholas | $93,500 | -- | |
| Cedar Creek Properties | $275,000 | -- | |
| Buchanan Eddie Wayne | $111,500 | -- | |
| Buchanan Ray | $111,500 | -- | |
| -- | -- | -- |
Source: Public Records
Mortgage History
| Date | Status | Borrower | Loan Amount |
|---|---|---|---|
| Open | Not Available | $151,350 |
Source: Public Records
Tax History Compared to Growth
Tax History
| Year | Tax Paid | Tax Assessment Tax Assessment Total Assessment is a certain percentage of the fair market value that is determined by local assessors to be the total taxable value of land and additions on the property. | Land | Improvement |
|---|---|---|---|---|
| 2024 | $965 | $49,000 | $9,950 | $39,050 |
| 2023 | $965 | $49,000 | $0 | $0 |
| 2022 | $965 | $49,000 | $9,950 | $39,050 |
| 2021 | $965 | $49,000 | $9,950 | $39,050 |
| 2020 | $965 | $49,000 | $9,950 | $39,050 |
| 2019 | $875 | $41,075 | $5,225 | $35,850 |
| 2018 | $875 | $41,075 | $5,225 | $35,850 |
| 2017 | $875 | $41,075 | $5,225 | $35,850 |
| 2016 | $817 | $41,075 | $5,225 | $35,850 |
| 2015 | $760 | $41,075 | $5,225 | $35,850 |
| 2014 | -- | $39,925 | $5,225 | $34,700 |
| 2013 | -- | $45,725 | $0 | $0 |
Source: Public Records
Map
Nearby Homes
- 5601 Brights Pike
- 5556 Denton Dr
- 2551 Cedar Creek Rd
- 5659 Browning Way
- 1607 Weatherby Ct
- 2145 Fall Creek Rd
- 5110 Anne Cir
- 6312 Turners Pond Trail
- 6276 Outlook Trail
- 6350 Turners Pond Trail
- 6358 Turners Pond Trail
- 6312 Turners Pond Tr
- 6219 Outlook Trail
- 6213 Outlook Tr
- 6213 Outlook Trail
- 1955 Turner Landing Rd
- 1955 Turners Landing Rd
- 1987 Turners Landing Rd
- 5640 Brights Pike
- 5650 Brights Pike
- 5679 Brights Pike
- 5681 Brights Pike
- 5636 Brights Pike
- 5654 Brights Pike
- 5675 Brights Pike
- 5630 Brights Pike
- 5682 Brights Pike
- 5624 Brights Pike
- 5701 Brights Pike
- 5690 Brights Pike
- 2740 Plantation Dr
- 2734 Plantation Dr
- 5637 Brights Pike
- 2720 Plantation Dr
- 0 Brights Pike
- 5709 Brights Pike
- 2714 Plantation Dr
- 5694 Brights Pike