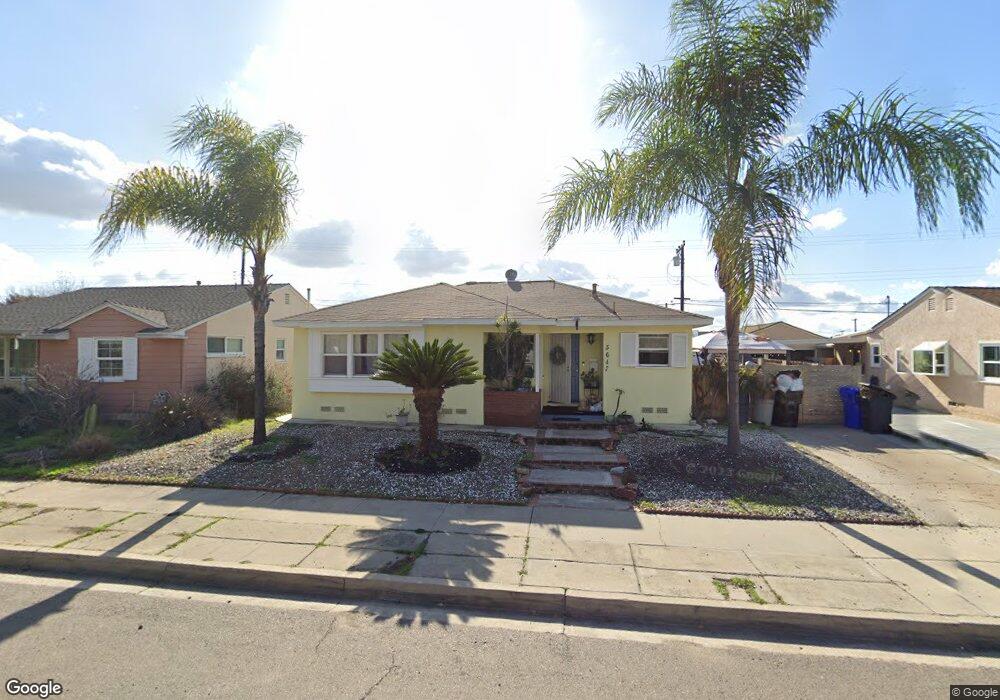
5647 Waring Rd San Diego, CA 92120
Allied Gardens NeighborhoodEstimated Value: $847,000 - $955,000
3
Beds
2
Baths
1,125
Sq Ft
$802/Sq Ft
Est. Value
About This Home
This home is located at 5647 Waring Rd, San Diego, CA 92120 and is currently estimated at $902,540, approximately $802 per square foot. 5647 Waring Rd is a home located in San Diego County with nearby schools including Marvin Elementary School, Lewis Middle School, and Patrick Henry High School.
Ownership History
Date
Name
Owned For
Owner Type
Purchase Details
Closed on
Nov 21, 2008
Sold by
Trang Diem Chau Nguyen
Bought by
Nguyen Thao P
Current Estimated Value
Home Financials for this Owner
Home Financials are based on the most recent Mortgage that was taken out on this home.
Original Mortgage
$270,000
Outstanding Balance
$175,650
Interest Rate
5.9%
Mortgage Type
Purchase Money Mortgage
Estimated Equity
$726,890
Purchase Details
Closed on
Jan 27, 2003
Sold by
Mai Phuong Bach
Bought by
Trang Diem Chau Nguyen
Purchase Details
Closed on
Mar 2, 2002
Sold by
Trang Jeffrey N and Trang Diem Chau Nguyen
Bought by
Mai Phuong Bach and Trang Diem Chau Nguyen
Purchase Details
Closed on
Feb 4, 2002
Sold by
Phuong Mai Bach
Bought by
Mai Phuong Bach and Trang Diem Chau Nguyen
Purchase Details
Closed on
Feb 16, 1998
Sold by
Nguyen Dat
Bought by
Phuong Mai B
Home Financials for this Owner
Home Financials are based on the most recent Mortgage that was taken out on this home.
Original Mortgage
$130,000
Interest Rate
6.91%
Purchase Details
Closed on
Sep 10, 1985
Create a Home Valuation Report for This Property
The Home Valuation Report is an in-depth analysis detailing your home's value as well as a comparison with similar homes in the area
Home Values in the Area
Average Home Value in this Area
Purchase History
| Date | Buyer | Sale Price | Title Company |
|---|---|---|---|
| Nguyen Thao P | $373,000 | Fidelity National Title Co | |
| Trang Diem Chau Nguyen | -- | -- | |
| Mai Phuong Bach | -- | Stewart Title | |
| Mai Phuong Bach | -- | Stewart Title | |
| Phuong Mai B | -- | Stewart Title | |
| -- | $89,000 | -- |
Source: Public Records
Mortgage History
| Date | Status | Borrower | Loan Amount |
|---|---|---|---|
| Open | Nguyen Thao P | $270,000 | |
| Previous Owner | Phuong Mai B | $130,000 |
Source: Public Records
Tax History Compared to Growth
Tax History
| Year | Tax Paid | Tax Assessment Tax Assessment Total Assessment is a certain percentage of the fair market value that is determined by local assessors to be the total taxable value of land and additions on the property. | Land | Improvement |
|---|---|---|---|---|
| 2025 | $5,617 | $463,574 | $334,807 | $128,767 |
| 2024 | $5,617 | $454,486 | $328,243 | $126,243 |
| 2023 | $5,492 | $445,575 | $321,807 | $123,768 |
| 2022 | $5,346 | $436,840 | $315,498 | $121,342 |
| 2021 | $5,310 | $428,275 | $309,312 | $118,963 |
| 2020 | $5,246 | $423,885 | $306,141 | $117,744 |
| 2019 | $5,153 | $415,575 | $300,139 | $115,436 |
| 2018 | $4,818 | $407,427 | $294,254 | $113,173 |
| 2017 | $80 | $399,439 | $288,485 | $110,954 |
| 2016 | $4,628 | $391,608 | $282,829 | $108,779 |
| 2015 | $4,560 | $385,727 | $278,581 | $107,146 |
| 2014 | $4,489 | $378,172 | $273,124 | $105,048 |
Source: Public Records
Map
Nearby Homes
- 6330 Wenrich Dr
- 5586 Hamill Ave
- 6817 Birchwood St
- 5956 Crow Ct
- 5468 Princess View Place
- 7391 Margerum Ave
- 6240 Bernadette Ln
- 6662 Birchwood St
- 5564 Fontaine St
- 7310 Margerum Ave
- 6329 Caminito Estrellado
- 6016 Wenrich Place
- 5253 Lewison Place
- 6303 Caminito Tenedor
- 6221 Brynwood Ct
- 7137 Keighley St
- 5996 College Ave
- 6183 Rockhurst Dr
- 5968 Caminito de la Taza
- 5957 Caminito de la Taza
- 5659 Waring Rd
- 5635 Waring Rd
- 5634 Barclay Ave
- 5626 Barclay Ave
- 5642 Barclay Ave
- 5671 Waring Rd
- 5623 Waring Rd
- 5650 Barclay Ave
- 5618 Barclay Ave
- 5683 Waring Rd
- 5611 Waring Rd
- 5648 Waring Rd
- 5610 Barclay Ave
- 5658 Barclay Ave
- 5660 Waring Rd
- 5636 Waring Rd
- 5672 Waring Rd
- 5624 Waring Rd Unit 6
- 5701 Waring Rd
- 5601 Waring Rd