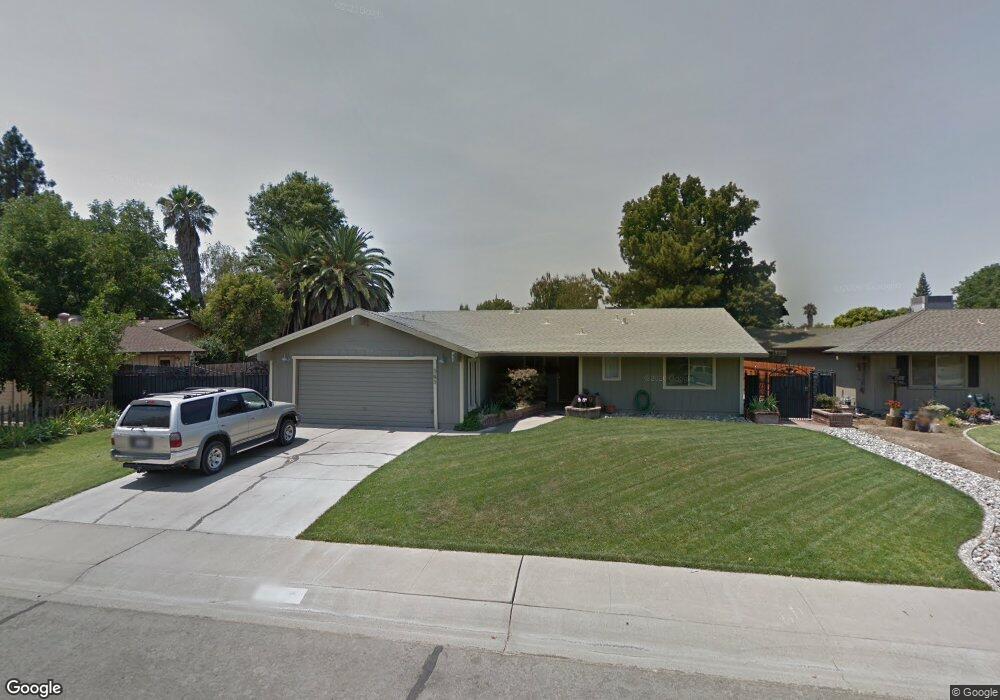
565 Clint Way Yuba City, CA 95993
Estimated Value: $339,000 - $416,000
3
Beds
2
Baths
1,312
Sq Ft
$287/Sq Ft
Est. Value
About This Home
This home is located at 565 Clint Way, Yuba City, CA 95993 and is currently estimated at $376,993, approximately $287 per square foot. 565 Clint Way is a home located in Sutter County with nearby schools including Lincoln Elementary School, Yuba City High School, and St. Isidore Catholic School.
Ownership History
Date
Name
Owned For
Owner Type
Purchase Details
Closed on
Aug 1, 2013
Sold by
Raczynski Richard and Raczynski Carlene
Bought by
Raczynski Kyle
Current Estimated Value
Home Financials for this Owner
Home Financials are based on the most recent Mortgage that was taken out on this home.
Original Mortgage
$92,000
Outstanding Balance
$68,608
Interest Rate
4.46%
Mortgage Type
New Conventional
Estimated Equity
$308,385
Purchase Details
Closed on
Mar 20, 2011
Sold by
Jpmc Specialty Mortgage Llc
Bought by
Raczynski Kyle and Raczynski Richard
Home Financials for this Owner
Home Financials are based on the most recent Mortgage that was taken out on this home.
Original Mortgage
$88,575
Interest Rate
4.87%
Mortgage Type
FHA
Purchase Details
Closed on
Nov 30, 2010
Sold by
Sayady Mogtaba
Bought by
Jpmc Specialty Mortgage Llc
Create a Home Valuation Report for This Property
The Home Valuation Report is an in-depth analysis detailing your home's value as well as a comparison with similar homes in the area
Home Values in the Area
Average Home Value in this Area
Purchase History
| Date | Buyer | Sale Price | Title Company |
|---|---|---|---|
| Raczynski Kyle | -- | First American Title Company | |
| Raczynski Kyle | $91,000 | Ticor Title Company Of Ca | |
| Jpmc Specialty Mortgage Llc | $114,200 | Accommodation |
Source: Public Records
Mortgage History
| Date | Status | Borrower | Loan Amount |
|---|---|---|---|
| Open | Raczynski Kyle | $92,000 | |
| Closed | Raczynski Kyle | $88,575 |
Source: Public Records
Tax History Compared to Growth
Tax History
| Year | Tax Paid | Tax Assessment Tax Assessment Total Assessment is a certain percentage of the fair market value that is determined by local assessors to be the total taxable value of land and additions on the property. | Land | Improvement |
|---|---|---|---|---|
| 2025 | $1,369 | $116,575 | $38,430 | $78,145 |
| 2024 | $1,369 | $114,290 | $37,677 | $76,613 |
| 2023 | $1,369 | $112,050 | $36,939 | $75,111 |
| 2022 | $1,314 | $109,854 | $36,215 | $73,639 |
| 2021 | $1,299 | $107,710 | $35,509 | $72,201 |
| 2020 | $1,278 | $106,604 | $35,144 | $71,460 |
| 2019 | $1,251 | $104,514 | $34,455 | $70,059 |
| 2018 | $1,233 | $102,465 | $33,780 | $68,685 |
| 2017 | $1,204 | $100,456 | $33,117 | $67,339 |
| 2016 | $1,181 | $98,486 | $32,468 | $66,018 |
| 2015 | $1,163 | $97,006 | $31,980 | $65,026 |
| 2014 | $1,150 | $95,106 | $31,354 | $63,752 |
Source: Public Records
Map
Nearby Homes
- 650 Gregory Dr
- 1910 Jacob Dr
- 238 Anita Way
- 872 Mesa Verde
- 1665 Michelle Dr
- 1018 Petty Ct
- 187 Rai Estates Ct
- 1545 Camino Del Oro
- 156 Bristol Way
- 1955 Jason Ct
- 138 Nantucket Way
- 1421 Richland Rd
- 1105 Johnathan Dr
- 1150 Pico Ct
- 2185 Lincoln Rd
- 241 Littlejohn Rd
- 1781 Franklin Rd Unit 36
- 2057 Nicholas Dr
- 2038 Nicholas Dr
- 582 Camino Cortez