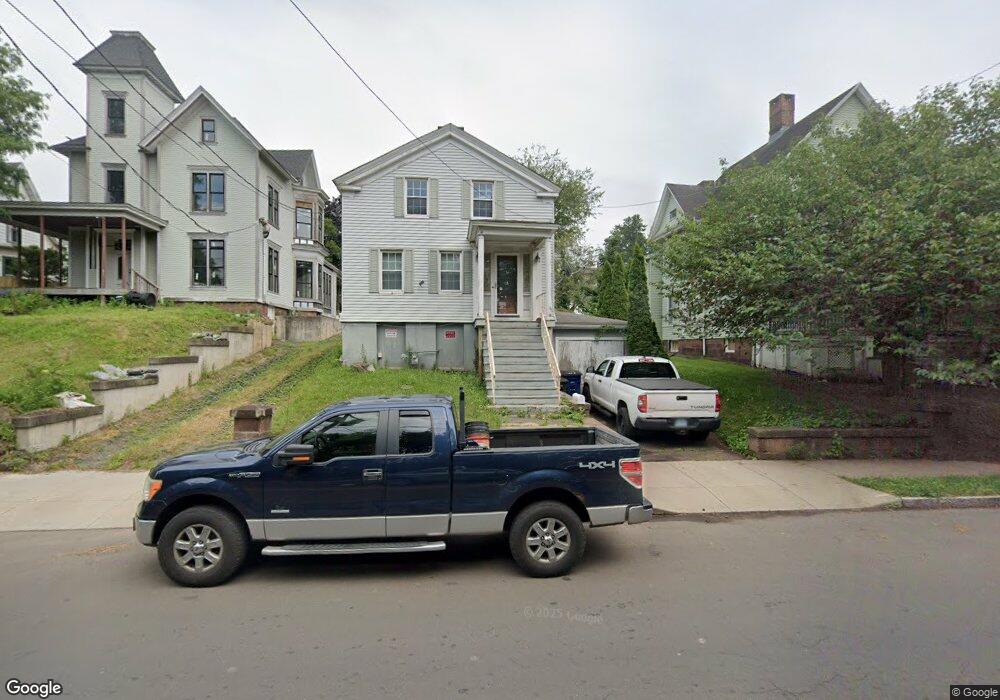
565 Quinnipiac Ave New Haven, CT 06513
Fair Haven Heights NeighborhoodEstimated Value: $270,984 - $314,000
2
Beds
1
Bath
1,196
Sq Ft
$240/Sq Ft
Est. Value
About This Home
This home is located at 565 Quinnipiac Ave, New Haven, CT 06513 and is currently estimated at $286,996, approximately $239 per square foot. 565 Quinnipiac Ave is a home located in New Haven County with nearby schools including Ross Woodward, St Francis & St Rose Of Lima School, and All Nations Christian Academy.
Ownership History
Date
Name
Owned For
Owner Type
Purchase Details
Closed on
Nov 5, 1998
Sold by
Donahue Mike O
Bought by
Rosa Timothy M and Rosa Cheryl S
Current Estimated Value
Home Financials for this Owner
Home Financials are based on the most recent Mortgage that was taken out on this home.
Original Mortgage
$27,000
Interest Rate
6.64%
Create a Home Valuation Report for This Property
The Home Valuation Report is an in-depth analysis detailing your home's value as well as a comparison with similar homes in the area
Home Values in the Area
Average Home Value in this Area
Purchase History
| Date | Buyer | Sale Price | Title Company |
|---|---|---|---|
| Rosa Timothy M | $30,000 | -- |
Source: Public Records
Mortgage History
| Date | Status | Borrower | Loan Amount |
|---|---|---|---|
| Closed | Rosa Timothy M | $75,000 | |
| Closed | Rosa Timothy M | $30,000 | |
| Closed | Rosa Timothy M | $80,000 | |
| Closed | Rosa Timothy M | $27,000 |
Source: Public Records
Tax History Compared to Growth
Tax History
| Year | Tax Paid | Tax Assessment Tax Assessment Total Assessment is a certain percentage of the fair market value that is determined by local assessors to be the total taxable value of land and additions on the property. | Land | Improvement |
|---|---|---|---|---|
| 2025 | $4,239 | $107,590 | $36,120 | $71,470 |
| 2024 | $4,142 | $107,590 | $36,120 | $71,470 |
| 2023 | $4,002 | $107,590 | $36,120 | $71,470 |
| 2022 | $4,277 | $107,590 | $36,120 | $71,470 |
| 2021 | $3,231 | $73,640 | $17,360 | $56,280 |
| 2020 | $3,231 | $73,640 | $17,360 | $56,280 |
| 2019 | $3,165 | $73,640 | $17,360 | $56,280 |
| 2018 | $3,165 | $73,640 | $17,360 | $56,280 |
| 2017 | $2,848 | $73,640 | $17,360 | $56,280 |
| 2016 | $2,894 | $69,650 | $26,040 | $43,610 |
| 2015 | $2,894 | $69,650 | $26,040 | $43,610 |
| 2014 | $2,894 | $69,650 | $26,040 | $43,610 |
Source: Public Records
Map
Nearby Homes
- 533 Quinnipiac Ave
- 314 Lenox St
- 265 Lexington Ave
- 674 Quinnipiac Ave
- 76 Front St Unit 76
- 100 Front St Unit 100
- 8 Front St Unit D
- 43 E Pearl St
- 1 Front St Unit 1 Kel
- 714 Quinnipiac Ave
- 32 E Pearl St
- 71 Houston St
- 95 Lenox St Unit L
- 728 Quinnipiac Ave
- 33 Chapel St
- 72 Pierpont St
- 121 Lexington Ave Unit 21
- 191 Ferry St
- 85 Pierpont St
- 12 E Ferry St
- 561 Quinnipiac Ave
- 571 Quinnipiac Ave
- 577 Quinnipiac Ave Unit 2
- 577 Quinnipiac Ave
- 553 Quinnipiac Ave
- 238 Lenox St
- 585 Quinnipiac Ave
- 585 Quinnipiac Ave Unit 2nd Floor
- 547 Quinnipiac Ave
- 583 Quinnipiac Ave
- 17 Aner St
- 250 Lenox St
- 543 Quinnipiac Ave
- 232 Lenox St
- 264 Lenox St
- 589 Quinnipiac Ave
- 539 Quinnipiac Ave
- 539 Quinnipiac Ave Unit 1
- 257 Lenox St
- 537 Quinnipiac Ave