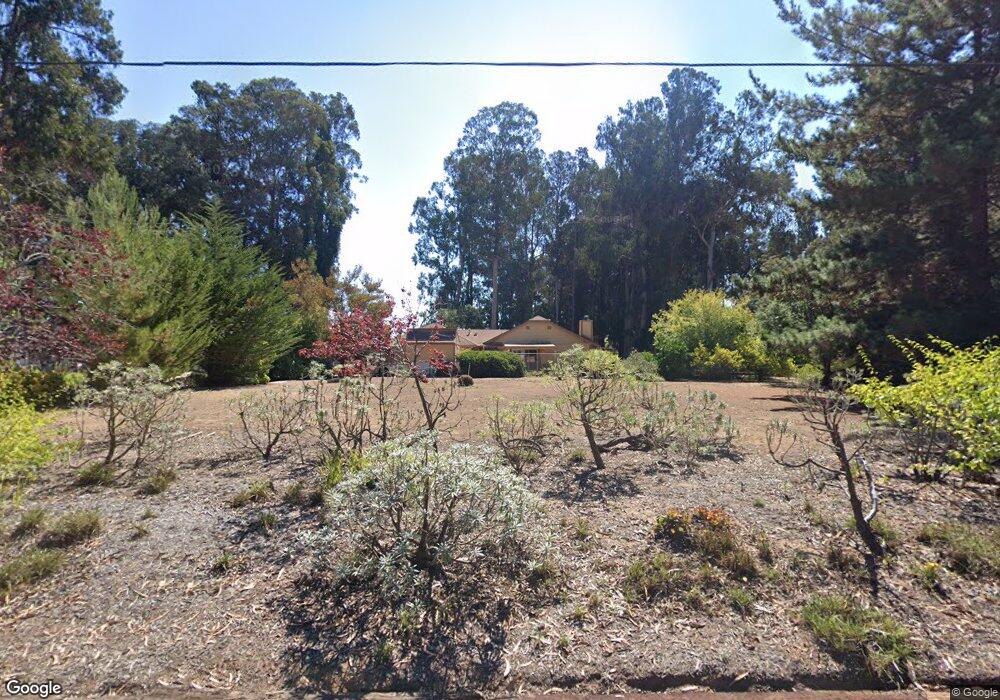
565 Sandydale Dr Nipomo, CA 93444
Estimated Value: $973,000 - $1,095,000
4
Beds
2
Baths
2,000
Sq Ft
$511/Sq Ft
Est. Value
About This Home
This home is located at 565 Sandydale Dr, Nipomo, CA 93444 and is currently estimated at $1,022,120, approximately $511 per square foot. 565 Sandydale Dr is a home located in San Luis Obispo County with nearby schools including Dana Elementary School, Mesa Middle School, and Nipomo High School.
Ownership History
Date
Name
Owned For
Owner Type
Purchase Details
Closed on
Feb 10, 2017
Sold by
Bouchard Laurence L and Bouchard Carolyn A
Bought by
Bouchard Laurence L and Bouchard Carolyn A
Current Estimated Value
Purchase Details
Closed on
Nov 21, 2001
Sold by
Reynolds James and Reynolds Marlene
Bought by
Bouchard Laurence L and Bouchard Carolyn A
Home Financials for this Owner
Home Financials are based on the most recent Mortgage that was taken out on this home.
Original Mortgage
$50,000
Interest Rate
6.57%
Purchase Details
Closed on
Jun 8, 1995
Sold by
Blum John A and Blum Constance
Bought by
Reynolds James and Reynolds Marlene
Home Financials for this Owner
Home Financials are based on the most recent Mortgage that was taken out on this home.
Original Mortgage
$117,000
Interest Rate
7.61%
Create a Home Valuation Report for This Property
The Home Valuation Report is an in-depth analysis detailing your home's value as well as a comparison with similar homes in the area
Home Values in the Area
Average Home Value in this Area
Purchase History
| Date | Buyer | Sale Price | Title Company |
|---|---|---|---|
| Bouchard Laurence L | -- | None Available | |
| Bouchard Laurence L | $378,000 | Fidelity National Title Co | |
| Reynolds James | $220,000 | Chicago Title Co |
Source: Public Records
Mortgage History
| Date | Status | Borrower | Loan Amount |
|---|---|---|---|
| Closed | Bouchard Laurence L | $50,000 | |
| Previous Owner | Reynolds James | $117,000 |
Source: Public Records
Tax History
| Year | Tax Paid | Tax Assessment Tax Assessment Total Assessment is a certain percentage of the fair market value that is determined by local assessors to be the total taxable value of land and additions on the property. | Land | Improvement |
|---|---|---|---|---|
| 2025 | $5,670 | $558,400 | $206,813 | $351,587 |
| 2024 | $5,604 | $547,452 | $202,758 | $344,694 |
| 2023 | $5,604 | $536,719 | $198,783 | $337,936 |
| 2022 | $5,518 | $526,196 | $194,886 | $331,310 |
| 2021 | $5,506 | $515,879 | $191,065 | $324,814 |
| 2020 | $5,442 | $510,590 | $189,106 | $321,484 |
| 2019 | $5,408 | $500,580 | $185,399 | $315,181 |
| 2018 | $5,342 | $490,765 | $181,764 | $309,001 |
| 2017 | $5,240 | $481,143 | $178,200 | $302,943 |
| 2016 | $4,941 | $471,709 | $174,706 | $297,003 |
| 2015 | $4,869 | $464,624 | $172,082 | $292,542 |
| 2014 | $4,687 | $455,524 | $168,712 | $286,812 |
Source: Public Records
Map
Nearby Homes
- 745 Inga Rd
- 228 Chaparral Ln
- 825 Sandydale Dr
- 219 Lema Dr
- 1010 1012 Upper Los Berros Rd
- 770 & 772 Beverly
- 182 172 E Chestnut
- 290 Daffodil Ave
- 778 Primrose Ln
- 160 San Antonio Ln
- 719 W Tefft St
- 449 W Tefft St
- 449 W Tefft St Unit 22
- 449 W Tefft St Unit 23
- 449 W Tefft St Unit 13
- 680 Hill St
- 267 W Tefft St
- 1 W Branch St
- 230 Hans Place
- 150 E Chestnut St
Your Personal Tour Guide
Ask me questions while you tour the home.