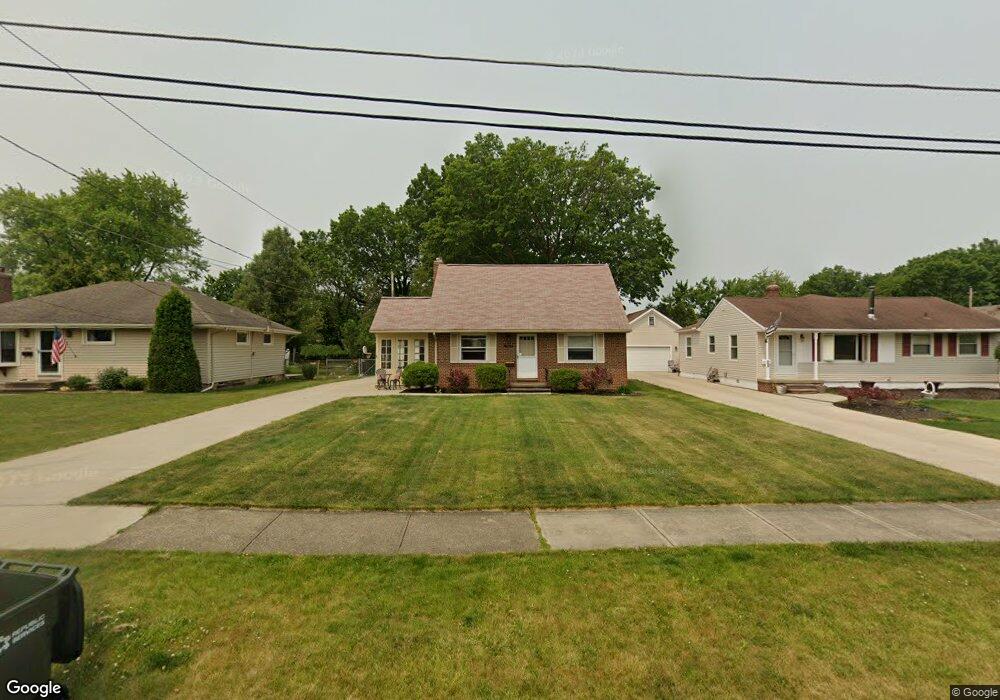
5650 W 224th St Cleveland, OH 44126
Estimated Value: $263,246 - $287,000
3
Beds
2
Baths
1,260
Sq Ft
$219/Sq Ft
Est. Value
About This Home
This home is located at 5650 W 224th St, Cleveland, OH 44126 and is currently estimated at $275,312, approximately $218 per square foot. 5650 W 224th St is a home located in Cuyahoga County with nearby schools including Gilles-Sweet Elementary School, Lewis F Mayer Middle School, and Fairview High School.
Ownership History
Date
Name
Owned For
Owner Type
Purchase Details
Closed on
May 20, 2025
Sold by
Johnson Kenneth R and Johnson Kathryn Y
Bought by
Johnson Family Revocable Trust and Johnson
Current Estimated Value
Purchase Details
Closed on
Jul 6, 1995
Sold by
Koszkalda Robert W
Bought by
Johnson Kenneth R and Johnson Kathryn Y
Home Financials for this Owner
Home Financials are based on the most recent Mortgage that was taken out on this home.
Original Mortgage
$95,500
Interest Rate
7.9%
Mortgage Type
New Conventional
Purchase Details
Closed on
May 24, 1985
Sold by
Wilkenson William Michael
Bought by
Koszkalda Robert W
Purchase Details
Closed on
Jul 14, 1978
Sold by
Johnson Paul T and Johnson Susan H
Bought by
Wilkenson William Michael
Purchase Details
Closed on
Aug 20, 1975
Sold by
Bowers David R and Bowers Carole L
Bought by
Johnson Paul T and Johnson Susan H
Purchase Details
Closed on
Jan 1, 1975
Bought by
Bowers David R and Bowers Carole L
Create a Home Valuation Report for This Property
The Home Valuation Report is an in-depth analysis detailing your home's value as well as a comparison with similar homes in the area
Home Values in the Area
Average Home Value in this Area
Purchase History
| Date | Buyer | Sale Price | Title Company |
|---|---|---|---|
| Johnson Family Revocable Trust | -- | None Listed On Document | |
| Johnson Kenneth R | $112,500 | -- | |
| Koszkalda Robert W | $68,000 | -- | |
| Wilkenson William Michael | $62,500 | -- | |
| Johnson Paul T | $41,500 | -- | |
| Bowers David R | -- | -- |
Source: Public Records
Mortgage History
| Date | Status | Borrower | Loan Amount |
|---|---|---|---|
| Previous Owner | Johnson Kenneth R | $95,500 |
Source: Public Records
Tax History Compared to Growth
Tax History
| Year | Tax Paid | Tax Assessment Tax Assessment Total Assessment is a certain percentage of the fair market value that is determined by local assessors to be the total taxable value of land and additions on the property. | Land | Improvement |
|---|---|---|---|---|
| 2024 | $6,088 | $88,620 | $17,955 | $70,665 |
| 2023 | $4,917 | $60,940 | $12,430 | $48,510 |
| 2022 | $4,797 | $60,940 | $12,430 | $48,510 |
| 2021 | $4,895 | $60,940 | $12,430 | $48,510 |
| 2020 | $4,765 | $52,080 | $10,610 | $41,480 |
| 2019 | $4,237 | $148,800 | $30,300 | $118,500 |
| 2018 | $3,945 | $52,080 | $10,610 | $41,480 |
| 2017 | $3,826 | $43,370 | $11,130 | $32,240 |
| 2016 | $3,801 | $43,370 | $11,130 | $32,240 |
| 2015 | $3,592 | $43,370 | $11,130 | $32,240 |
| 2014 | $3,592 | $41,310 | $10,610 | $30,700 |
Source: Public Records
Map
Nearby Homes
- 22439 Haber Dr
- 22276 Sycamore Dr
- 22250 Mastick Rd
- 22640 Lenox Dr
- 22537 Lenox Dr
- 22534 Bard Ave
- 22831 Esther Ave
- 22636 Mastick Rd
- 22934 Mastick Rd Unit 102
- 22503 Sandy Ln
- 5300 Sherwood Dr
- 22895 Mastick Rd
- 23052 Mastick Rd
- 21877 Seabury Ave
- 4590 Brendan Ln
- 4666 Brendan Cir
- 4570 W 228th St
- 23540 David Dr Unit 113C
- 4480 W 224th St
- 4550 Georgette Ave
- 5640 W 224th St
- 5660 W 224th St
- 5672 W 224th St
- 22455 Haber Dr
- 22440 Sycamore Dr
- 5690 W 224th St
- 22495 Haber Dr
- 5645 W 224th St
- 5625 W 224th St
- 22470 Sycamore Dr
- 22355 Haber Dr
- 5655 W 224th St
- 5665 W 224th St
- 22500 Sycamore Dr
- 22410 Haber Dr
- 5675 W 224th St
- 22450 Haber Dr
- 5720 W 224th St
- 22305 Haber Dr
- 22530 Sycamore Dr