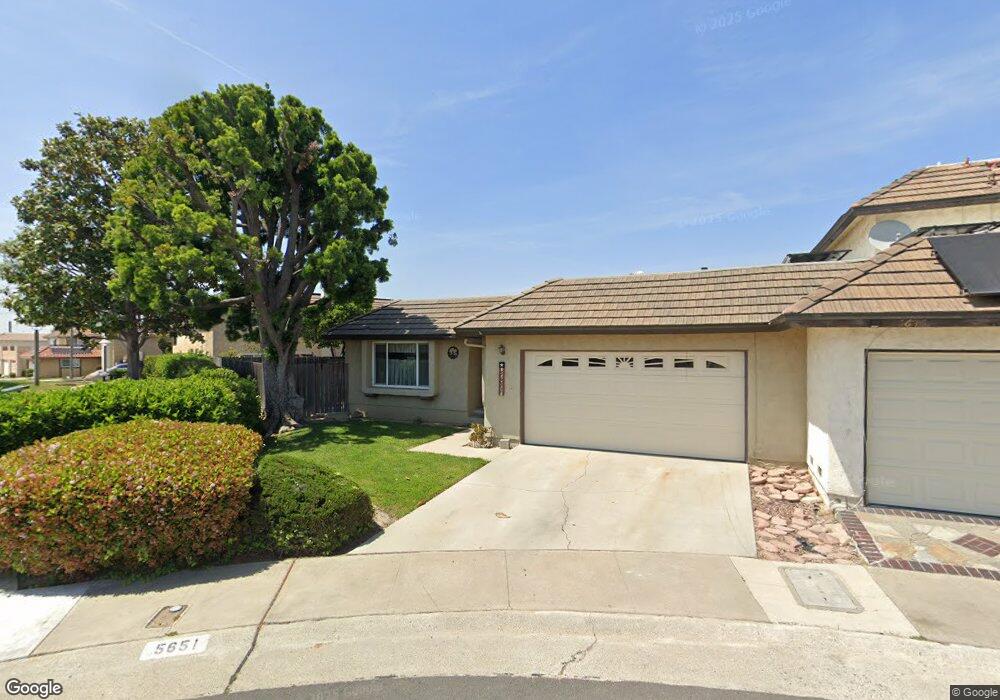
5651 Tahoe Cir Buena Park, CA 90621
Estimated Value: $778,000 - $824,000
2
Beds
2
Baths
1,313
Sq Ft
$613/Sq Ft
Est. Value
About This Home
This home is located at 5651 Tahoe Cir, Buena Park, CA 90621 and is currently estimated at $805,202, approximately $613 per square foot. 5651 Tahoe Cir is a home located in Orange County with nearby schools including Gordon H. Beatty Elementary School, Buena Park Junior High School, and Sunny Hills High School.
Ownership History
Date
Name
Owned For
Owner Type
Purchase Details
Closed on
Aug 27, 2020
Sold by
Mccabe Michael R and Mccabe Family Trust
Bought by
Mccabe Scott and Mccabe Teresa
Current Estimated Value
Purchase Details
Closed on
Dec 1, 2008
Sold by
Mccabe Betty Bea
Bought by
Mccabe Betty Bea and The Mccabe Family Trust Subtrust A
Purchase Details
Closed on
Oct 14, 1999
Sold by
Mccabe Herbert and Mccabe Betty
Bought by
Mccabe Herbert R and Mccabe Betty
Purchase Details
Closed on
Mar 30, 1999
Sold by
Barr David S and Barr Lisa J
Bought by
Mccabe Herbert and Mccabe Betty
Home Financials for this Owner
Home Financials are based on the most recent Mortgage that was taken out on this home.
Original Mortgage
$121,800
Outstanding Balance
$30,688
Interest Rate
6.98%
Estimated Equity
$774,514
Create a Home Valuation Report for This Property
The Home Valuation Report is an in-depth analysis detailing your home's value as well as a comparison with similar homes in the area
Home Values in the Area
Average Home Value in this Area
Purchase History
| Date | Buyer | Sale Price | Title Company |
|---|---|---|---|
| Mccabe Scott | -- | None Available | |
| Mccabe Betty Bea | -- | None Available | |
| Mccabe Herbert R | -- | -- | |
| Mccabe Herbert | $174,000 | North American Title Co |
Source: Public Records
Mortgage History
| Date | Status | Borrower | Loan Amount |
|---|---|---|---|
| Open | Mccabe Herbert | $121,800 |
Source: Public Records
Tax History Compared to Growth
Tax History
| Year | Tax Paid | Tax Assessment Tax Assessment Total Assessment is a certain percentage of the fair market value that is determined by local assessors to be the total taxable value of land and additions on the property. | Land | Improvement |
|---|---|---|---|---|
| 2025 | $3,282 | $272,768 | $172,920 | $99,848 |
| 2024 | $3,282 | $267,420 | $169,529 | $97,891 |
| 2023 | $3,213 | $262,177 | $166,205 | $95,972 |
| 2022 | $3,159 | $257,037 | $162,946 | $94,091 |
| 2021 | $3,135 | $251,998 | $159,751 | $92,247 |
| 2020 | $3,097 | $249,415 | $158,113 | $91,302 |
| 2019 | $3,027 | $244,525 | $155,013 | $89,512 |
| 2018 | $2,970 | $239,731 | $151,974 | $87,757 |
| 2017 | $2,929 | $235,031 | $148,994 | $86,037 |
| 2016 | $2,872 | $230,423 | $146,073 | $84,350 |
| 2015 | $2,752 | $226,962 | $143,879 | $83,083 |
| 2014 | $2,740 | $222,517 | $141,061 | $81,456 |
Source: Public Records
Map
Nearby Homes
- 8237 Henshaw Cir
- 5588 Cajon Ave
- 5412 Arrowhead Ave
- 9 Coveside Ct
- 8542 Emerywood Dr
- 65 Windward Way Unit 23
- 11 Travis Rd
- 5211 Fox Hills Ave
- 8244 Henderson Green
- 86 Lakeside Dr
- 5822 Fullerton Ave
- 5786 Kingman Ave
- 6 Tidewater Cove
- 5471 Jonesboro Way
- 6041 Fullerton Ave
- 11 Springwater Dr
- 4900 Lincolnshire Ave
- 5941 Kingman Ave
- 4840 Sunnybrook Ave
- 4738 Durango Dr
- 5645 Tahoe Cir
- 8226 Henshaw Cir
- 5640 Elsinore Ave
- 5634 Elsinore Ave
- 8230 Henshaw Cir
- 5628 Elsinore Ave
- 8234 Henshaw Cir
- 5646 Tahoe Cir
- 5622 Elsinore Ave
- 8238 Henshaw Cir
- 5673 Tahoe Cir
- 5652 Tahoe Cir
- 8242 Henshaw Cir
- 5658 Tahoe Cir
- 5654 Elsinore Ave
- 5664 Tahoe Cir
- 5610 Elsinore Ave
- 5679 Tahoe Cir
- 5670 Tahoe Cir
- 8211 Owens St