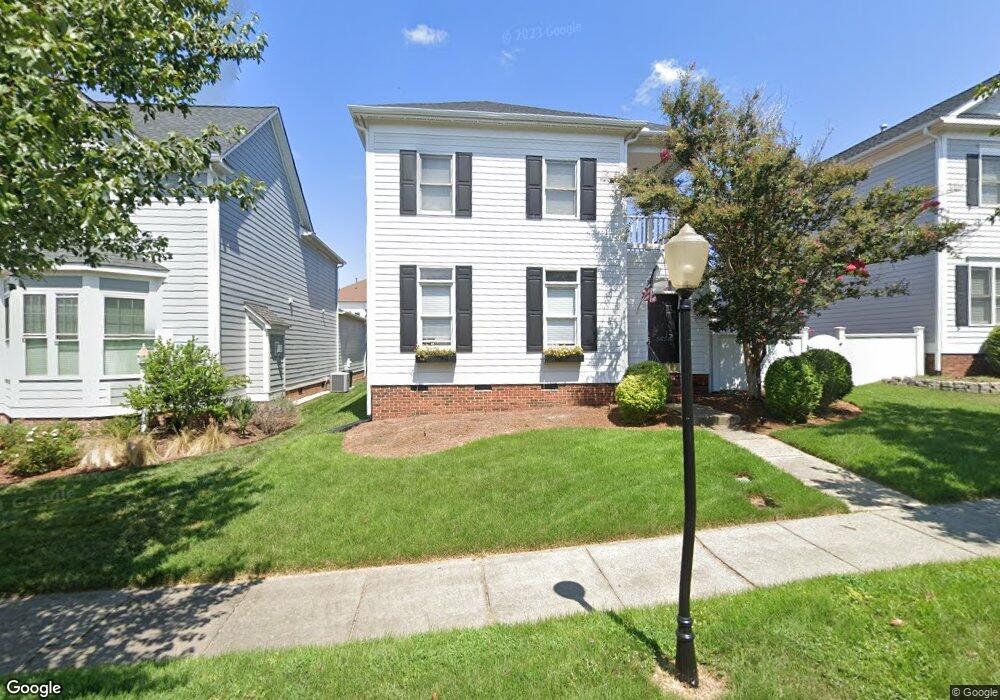
5654 Nolen Ave NW Unit 127 Concord, NC 28027
Estimated Value: $395,310 - $460,000
3
Beds
3
Baths
1,553
Sq Ft
$275/Sq Ft
Est. Value
About This Home
This home is located at 5654 Nolen Ave NW Unit 127, Concord, NC 28027 and is currently estimated at $426,328, approximately $274 per square foot. 5654 Nolen Ave NW Unit 127 is a home located in Cabarrus County with nearby schools including Charles E. Boger Elementary School, Northwest Cabarrus Middle School, and Cabarrus Charter Academy.
Ownership History
Date
Name
Owned For
Owner Type
Purchase Details
Closed on
Mar 4, 2016
Sold by
Holman Sheldon
Bought by
Grigsby Matthew
Current Estimated Value
Home Financials for this Owner
Home Financials are based on the most recent Mortgage that was taken out on this home.
Original Mortgage
$208,050
Outstanding Balance
$165,433
Interest Rate
3.79%
Mortgage Type
New Conventional
Estimated Equity
$260,895
Purchase Details
Closed on
Mar 10, 2005
Sold by
Vaughan Derek G
Bought by
Holman Sheldon
Home Financials for this Owner
Home Financials are based on the most recent Mortgage that was taken out on this home.
Original Mortgage
$146,400
Interest Rate
5.6%
Mortgage Type
Purchase Money Mortgage
Purchase Details
Closed on
Sep 19, 2000
Sold by
Southern Village Homes Inc
Bought by
Vaughan Derek G
Home Financials for this Owner
Home Financials are based on the most recent Mortgage that was taken out on this home.
Original Mortgage
$150,000
Interest Rate
8.05%
Create a Home Valuation Report for This Property
The Home Valuation Report is an in-depth analysis detailing your home's value as well as a comparison with similar homes in the area
Home Values in the Area
Average Home Value in this Area
Purchase History
| Date | Buyer | Sale Price | Title Company |
|---|---|---|---|
| Grigsby Matthew | $220,000 | None Available | |
| Holman Sheldon | $183,000 | -- | |
| Vaughan Derek G | $158,000 | -- |
Source: Public Records
Mortgage History
| Date | Status | Borrower | Loan Amount |
|---|---|---|---|
| Open | Grigsby Matthew | $208,050 | |
| Previous Owner | Holman Sheldon | $146,400 | |
| Previous Owner | Vaughan Derek G | $150,000 | |
| Closed | Holman Sheldon | $18,300 |
Source: Public Records
Tax History Compared to Growth
Tax History
| Year | Tax Paid | Tax Assessment Tax Assessment Total Assessment is a certain percentage of the fair market value that is determined by local assessors to be the total taxable value of land and additions on the property. | Land | Improvement |
|---|---|---|---|---|
| 2025 | $3,325 | $333,820 | $80,000 | $253,820 |
| 2024 | $3,325 | $333,820 | $80,000 | $253,820 |
| 2023 | $3,109 | $254,820 | $87,000 | $167,820 |
| 2022 | $3,109 | $254,820 | $87,000 | $167,820 |
| 2021 | $3,109 | $254,820 | $87,000 | $167,820 |
| 2020 | $3,109 | $254,820 | $87,000 | $167,820 |
| 2019 | $2,482 | $203,460 | $55,000 | $148,460 |
| 2018 | $2,442 | $203,460 | $55,000 | $148,460 |
| 2017 | $2,401 | $203,460 | $55,000 | $148,460 |
| 2016 | $1,424 | $193,620 | $45,000 | $148,620 |
| 2015 | $2,285 | $193,620 | $45,000 | $148,620 |
| 2014 | $2,285 | $193,620 | $45,000 | $148,620 |
Source: Public Records
Map
Nearby Homes
- 75 Mccurdy St NW Unit 75
- 5505 Yorke St NW
- 5554 Village Dr NW
- 439 Beacon St NW
- 5461 Ives St NW
- 5618 Burck Dr NW
- 6115 Village Dr NW
- 6119 Village Dr NW
- 4946 Grand Canyon Rd NW
- 5185 Grand Canyon Rd NW
- 4909 Charmwood Ct NW
- 648 Kannapolis Pkwy
- 551 Hemmings Place NW
- 2514 Mountain Laurel Ave NW
- 561 Keystone Ct NW
- 888 Craigmont Ln NW
- 557 Keystone Ct NW
- 2504 Fallbrook Place NW
- 6525 Derby Ln NW
- 597 Gatsby Place NW
- 5654 Nolen Ave NW
- 5650 Nolen Ave NW
- 5650 Nolen Ave NW Unit 126
- 5658 Nolen Ave NW
- 5646 Nolen Ave NW
- 5642 Nolen Ave NW
- 5777 Village Dr NW
- 5781 Village Dr NW
- 5785 Village Dr NW
- 5769 Village Dr NW
- 5765 Village Dr NW
- 5761 Village Dr NW
- 5761 Village Dr NW Unit 5761
- 5728 Burck Dr NW
- 5732 Burck Dr NW
- 5732 Burck Dr NW Unit B
- 5730 Burck Dr NW
- 5757 Village Dr NW Unit 13
- 5757 Village Dr NW Unit 5
- 5653 Nolen Ave NW