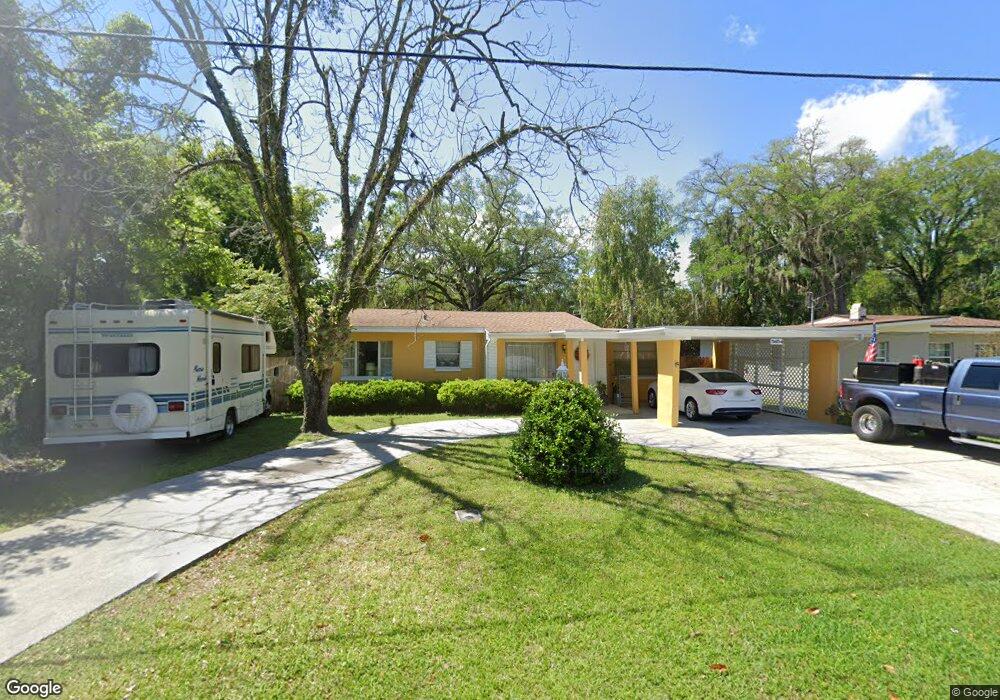
5654 Temple Rd Jacksonville, FL 32207
San Jose NeighborhoodEstimated Value: $223,000 - $249,000
3
Beds
2
Baths
1,277
Sq Ft
$182/Sq Ft
Est. Value
About This Home
This home is located at 5654 Temple Rd, Jacksonville, FL 32207 and is currently estimated at $232,093, approximately $181 per square foot. 5654 Temple Rd is a home located in Duval County with nearby schools including San Jose Elementary School, Alfred I. Dupont Middle School, and Terry Parker High School.
Ownership History
Date
Name
Owned For
Owner Type
Purchase Details
Closed on
Jun 7, 2016
Sold by
Johnson Rita E
Bought by
Johnson Ii Mark L and Johnson Rita E
Current Estimated Value
Purchase Details
Closed on
Sep 2, 2012
Sold by
Johnson Mark L and Johnson Rita E
Bought by
Johnson Rita E
Purchase Details
Closed on
May 14, 2007
Sold by
Nettles Wayne A and Nettles Rae Anne
Bought by
Johnson Ii Mark L and Johnson Rita E
Home Financials for this Owner
Home Financials are based on the most recent Mortgage that was taken out on this home.
Original Mortgage
$144,855
Interest Rate
6.17%
Mortgage Type
FHA
Purchase Details
Closed on
Apr 11, 2006
Sold by
Key Bank Na and Davis John R
Bought by
Herschkowitz Brian
Purchase Details
Closed on
Oct 25, 2002
Sold by
Booth Jessie M
Bought by
Nettles Wayne A and Nettles Rae Anne
Home Financials for this Owner
Home Financials are based on the most recent Mortgage that was taken out on this home.
Original Mortgage
$106,998
Interest Rate
6.01%
Mortgage Type
VA
Create a Home Valuation Report for This Property
The Home Valuation Report is an in-depth analysis detailing your home's value as well as a comparison with similar homes in the area
Home Values in the Area
Average Home Value in this Area
Purchase History
| Date | Buyer | Sale Price | Title Company |
|---|---|---|---|
| Johnson Ii Mark L | $50,800 | None Available | |
| Johnson Rita E | $68,000 | None Available | |
| Johnson Ii Mark L | $146,000 | Multiple | |
| Herschkowitz Brian | $45,000 | Attorney | |
| Nettles Wayne A | $104,900 | -- |
Source: Public Records
Mortgage History
| Date | Status | Borrower | Loan Amount |
|---|---|---|---|
| Previous Owner | Johnson Ii Mark L | $144,855 | |
| Previous Owner | Nettles Wayne A | $106,998 |
Source: Public Records
Tax History
| Year | Tax Paid | Tax Assessment Tax Assessment Total Assessment is a certain percentage of the fair market value that is determined by local assessors to be the total taxable value of land and additions on the property. | Land | Improvement |
|---|---|---|---|---|
| 2026 | $4,089 | $208,524 | $80,000 | $128,524 |
| 2025 | $3,755 | $208,463 | -- | -- |
| 2024 | $3,455 | $214,363 | $95,000 | $119,363 |
| 2023 | $3,455 | $195,576 | $65,000 | $130,576 |
| 2022 | $2,947 | $168,956 | $55,000 | $113,956 |
| 2021 | $2,730 | $146,958 | $55,000 | $91,958 |
| 2020 | $2,491 | $129,440 | $45,000 | $84,440 |
| 2019 | $2,421 | $125,115 | $45,000 | $80,115 |
| 2018 | $2,234 | $113,035 | $35,000 | $78,035 |
| 2017 | $2,091 | $105,839 | $25,500 | $80,339 |
| 2016 | $1,926 | $92,337 | $0 | $0 |
| 2015 | $2,050 | $104,181 | $0 | $0 |
| 2014 | $1,829 | $84,655 | $0 | $0 |
Source: Public Records
Map
Nearby Homes
- 5545 Patsy Anne Dr
- 2415 Brownwood Rd
- 1971 Lakewood Cir S
- 2477 Community Rd
- 6122 Suwanee Rd
- 6155 Temple Rd
- 5527 Graywood Rd
- 2456 Clemson Rd
- 2655 Community Rd
- 6237 Temple Rd
- 6338 Mercer Cir W
- 1888 Clemson Rd
- 1873 Stanford Rd N
- 2754 Rainbow Rd
- 1714 Furman Rd
- 5420 Stanford Rd
- 1605 Furman Rd
- 2944 University Blvd W
- 1718 Cornell Rd
- 5344 Tulane Ave
- 5644 Temple Rd
- 5660 Temple Rd
- 5625 Patsy Anne Dr
- 5638 Temple Rd
- 2311 University Blvd W
- 5651 Temple Rd
- 5630 Temple Rd
- 5659 Temple Rd
- 5645 Temple Rd
- 5617 Patsy Anne Dr
- 5671 Temple Rd
- 5637 Temple Rd
- 5624 Temple Rd
- 5611 Patsy Anne Dr
- 5629 Temple Rd
- 2415 University Blvd W Unit 1
- 5656 Orangewood Rd
- 5648 Orangewood Rd
- 5605 Patsy Anne Dr
- 5614 Temple Rd
Your Personal Tour Guide
Ask me questions while you tour the home.