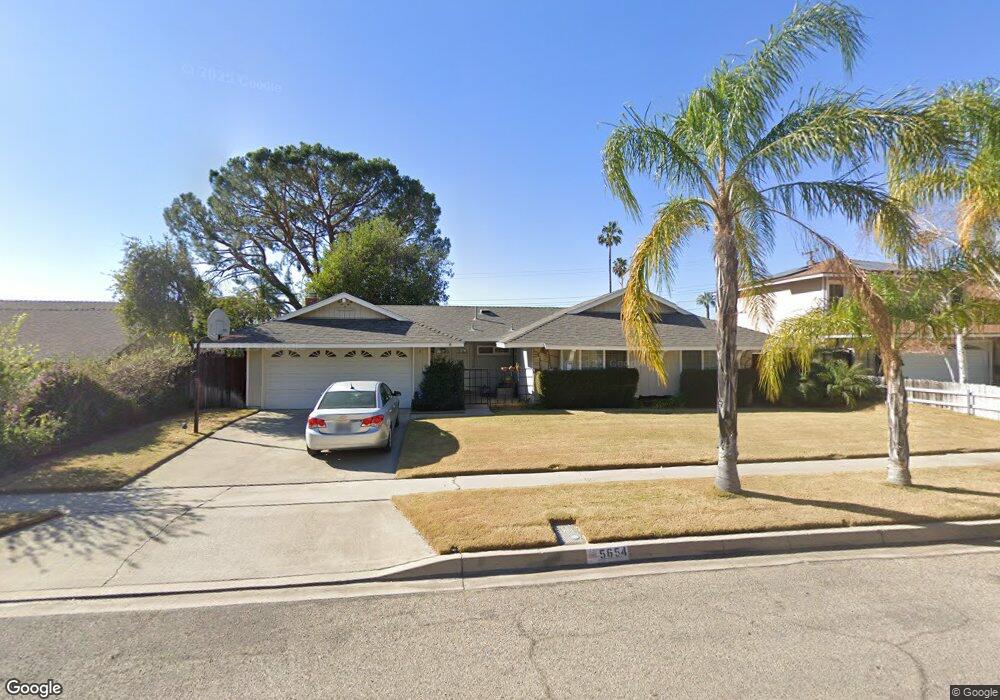
5654 Wadsworth Ave Highland, CA 92346
Belvedere NeighborhoodEstimated Value: $539,000 - $584,000
4
Beds
2
Baths
1,759
Sq Ft
$317/Sq Ft
Est. Value
About This Home
This home is located at 5654 Wadsworth Ave, Highland, CA 92346 and is currently estimated at $557,208, approximately $316 per square foot. 5654 Wadsworth Ave is a home located in San Bernardino County with nearby schools including Belvedere Elementary, Serrano Middle School, and San Gorgonio High School.
Ownership History
Date
Name
Owned For
Owner Type
Purchase Details
Closed on
Jul 7, 2008
Sold by
Chenes John A and Chenes Cindy N
Bought by
Hellman David
Current Estimated Value
Home Financials for this Owner
Home Financials are based on the most recent Mortgage that was taken out on this home.
Original Mortgage
$212,000
Outstanding Balance
$139,105
Interest Rate
6.41%
Mortgage Type
Purchase Money Mortgage
Estimated Equity
$418,103
Purchase Details
Closed on
Jun 14, 1995
Sold by
First Interstate Bank Of California
Bought by
Chenes John A and Chenes Cindy N
Home Financials for this Owner
Home Financials are based on the most recent Mortgage that was taken out on this home.
Original Mortgage
$84,400
Interest Rate
7.88%
Purchase Details
Closed on
Mar 15, 1995
Sold by
Lites Larry T and Lites Joan A
Bought by
First Interstate Bank Of California
Create a Home Valuation Report for This Property
The Home Valuation Report is an in-depth analysis detailing your home's value as well as a comparison with similar homes in the area
Home Values in the Area
Average Home Value in this Area
Purchase History
| Date | Buyer | Sale Price | Title Company |
|---|---|---|---|
| Hellman David | $265,000 | Chicago Title Co | |
| Chenes John A | $105,000 | Northern Counties Title | |
| First Interstate Bank Of California | $39,433 | Commonwealth Land Title Co |
Source: Public Records
Mortgage History
| Date | Status | Borrower | Loan Amount |
|---|---|---|---|
| Open | Hellman David | $212,000 | |
| Previous Owner | Chenes John A | $84,400 |
Source: Public Records
Tax History
| Year | Tax Paid | Tax Assessment Tax Assessment Total Assessment is a certain percentage of the fair market value that is determined by local assessors to be the total taxable value of land and additions on the property. | Land | Improvement |
|---|---|---|---|---|
| 2025 | $4,430 | $341,259 | $102,378 | $238,881 |
| 2024 | $4,339 | $334,568 | $100,371 | $234,197 |
| 2023 | $4,230 | $328,008 | $98,403 | $229,605 |
| 2022 | $4,239 | $321,577 | $96,474 | $225,103 |
| 2021 | $4,247 | $315,271 | $94,582 | $220,689 |
| 2020 | $4,259 | $312,038 | $93,612 | $218,426 |
| 2019 | $4,132 | $305,919 | $91,776 | $214,143 |
| 2018 | $3,778 | $287,000 | $86,100 | $200,900 |
| 2017 | $3,610 | $277,300 | $83,200 | $194,100 |
| 2016 | $3,340 | $259,200 | $77,800 | $181,400 |
| 2015 | $3,201 | $240,000 | $72,000 | $168,000 |
| 2014 | $2,854 | $216,000 | $65,000 | $151,000 |
Source: Public Records
Map
Nearby Homes
- 4040 E Piedmont Dr Unit 300
- 5625 Arden Ave
- 0 Willow Dr
- 5505 N Alto Dr
- 5975 Newcomb St
- 6090 Mirada Place
- 2855 Piedmont Dr
- 2637 Mirada St
- 2052 Ashwood Ct
- 25786 Alto Ct
- 2649 28th St
- 5728 Newbury Ave
- 6224 Stanton Ave
- 1974 E Lynwood Dr Unit 2B
- 25940 Date St
- 2692 E Highland Ave Unit 8
- 25820 Date St E
- 0 Sterling Lilac Ave Unit 25615203
- 2904 Oleta Ln
- 2692 Highland Ave Unit 90
- 5664 Wadsworth Ave
- 5655 Stanton Ave
- 5645 Stanton Ave
- 5665 Stanton Ave
- 5634 Wadsworth Ave
- 5655 Wadsworth Ave
- 5645 Wadsworth Ave
- 5665 Wadsworth Ave
- 26175 33rd St
- 5635 Wadsworth Ave
- 26163 33rd St
- 26189 33rd St
- 5625 Stanton Ave
- 26151 33rd St
- 5654 Belvedere Ave
- 5654 Stanton Ave
- 5664 Belvedere Ave
- 5644 Belvedere Ave
- 5644 Stanton Ave
- 5664 Stanton Ave
Your Personal Tour Guide
Ask me questions while you tour the home.