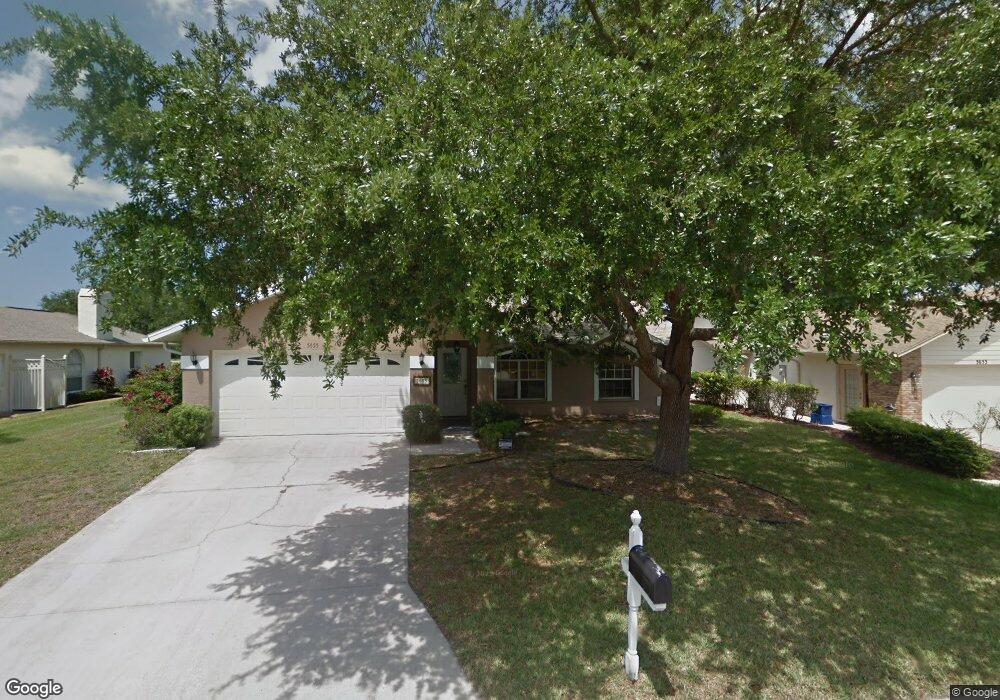
5655 29th Street Cir E Bradenton, FL 34203
Braden River NeighborhoodEstimated Value: $361,000 - $364,027
3
Beds
2
Baths
1,496
Sq Ft
$242/Sq Ft
Est. Value
About This Home
This home is located at 5655 29th Street Cir E, Bradenton, FL 34203 and is currently estimated at $362,257, approximately $242 per square foot. 5655 29th Street Cir E is a home located in Manatee County with nearby schools including Oneco Elementary School, Braden River Middle School, and Braden River High School.
Ownership History
Date
Name
Owned For
Owner Type
Purchase Details
Closed on
Jan 6, 2010
Sold by
Homecomings Financial Llc
Bought by
Schoenfelder Kristi L
Current Estimated Value
Purchase Details
Closed on
Nov 18, 2009
Sold by
Marlass Jhosua
Bought by
Homecomings Financial Llc
Purchase Details
Closed on
Feb 1, 2007
Sold by
Cendant Mobility Financial Corp
Bought by
Marlass Jhosua
Home Financials for this Owner
Home Financials are based on the most recent Mortgage that was taken out on this home.
Original Mortgage
$198,000
Interest Rate
7.25%
Mortgage Type
Purchase Money Mortgage
Purchase Details
Closed on
Dec 2, 2005
Sold by
Griffin Willie E and Griffin Lisa G
Bought by
Cendant Mobility Financial Corp
Purchase Details
Closed on
Jun 24, 1993
Sold by
Haney James D and Haney Joyce M
Bought by
Griffin Willie E and Griffin Lisa G
Home Financials for this Owner
Home Financials are based on the most recent Mortgage that was taken out on this home.
Original Mortgage
$88,700
Interest Rate
7.48%
Create a Home Valuation Report for This Property
The Home Valuation Report is an in-depth analysis detailing your home's value as well as a comparison with similar homes in the area
Home Values in the Area
Average Home Value in this Area
Purchase History
| Date | Buyer | Sale Price | Title Company |
|---|---|---|---|
| Schoenfelder Kristi L | $98,000 | Attorney | |
| Homecomings Financial Llc | $75,100 | Attorney | |
| Marlass Jhosua | $247,500 | Sunbelt Title Agency | |
| Cendant Mobility Financial Corp | $302,500 | Attorney | |
| Griffin Willie E | $93,500 | -- |
Source: Public Records
Mortgage History
| Date | Status | Borrower | Loan Amount |
|---|---|---|---|
| Previous Owner | Marlass Jhosua | $198,000 | |
| Previous Owner | Griffin Willie E | $88,700 |
Source: Public Records
Tax History Compared to Growth
Tax History
| Year | Tax Paid | Tax Assessment Tax Assessment Total Assessment is a certain percentage of the fair market value that is determined by local assessors to be the total taxable value of land and additions on the property. | Land | Improvement |
|---|---|---|---|---|
| 2025 | $4,437 | $281,370 | $51,000 | $230,370 |
| 2024 | $4,437 | $310,014 | $51,000 | $259,014 |
| 2023 | $4,326 | $313,060 | $51,000 | $262,060 |
| 2022 | $3,917 | $275,820 | $50,000 | $225,820 |
| 2021 | $3,207 | $199,780 | $47,500 | $152,280 |
| 2020 | $3,147 | $186,674 | $40,000 | $146,674 |
| 2019 | $3,106 | $182,751 | $40,000 | $142,751 |
| 2018 | $2,962 | $178,453 | $41,000 | $137,453 |
| 2017 | $2,637 | $170,529 | $0 | $0 |
| 2016 | $2,406 | $147,386 | $0 | $0 |
| 2015 | $2,020 | $135,894 | $0 | $0 |
| 2014 | $2,020 | $115,895 | $0 | $0 |
| 2013 | $1,839 | $103,478 | $25,250 | $78,228 |
Source: Public Records
Map
Nearby Homes
- 3157 57th Avenue Cir E
- 3117 57th Avenue Cir E
- 5717 28th St E
- 3404 56th Dr E
- 5542 34th Ct E
- 3427 55th Dr E
- 5714 Garden Lakes Fern
- 5807 Garden Lakes Fern Unit 181
- 5502 Garden Lakes Oak
- 5517 Garden Lakes Oak Unit 1
- 5682 25th Street Cir E
- 5727 Garden Lakes Palm Unit 97
- 5528 24th St E
- 5231 32nd St E
- 5812 Garden Lakes Dr Unit 152
- 5714 Garden Lakes Dr Unit 50
- 5712 Garden Lakes Dr Unit 49
- 6009 Cedarwood Ln
- 5538 Spanish Moss Cove
- 5523 Spanish Moss Cove
- 5653 29th Street Cir E
- 5657 29th Street Cir E
- 5607 30th Ct E Unit 2
- 5607 E Ct
- 5651 29th Street Cir E
- 5609 30th Ct E
- 5654 29th Street Cir E
- 5652 29th Street Cir E
- 5605 30th Ct E
- 5656 29th Street Cir E
- 5652 29th Street Cir E
- 5650 29th Street Cir E
- 5649 29th Street Cir E
- 5650 29th Street Cir E
- 5649 29th Street Cir E Unit 2
- 5610 30th Ct E
- 5603 30th Ct E
- 3175 57th Avenue Cir E
- 5648 29th Street Cir E
- 5648 29th Street Cir E