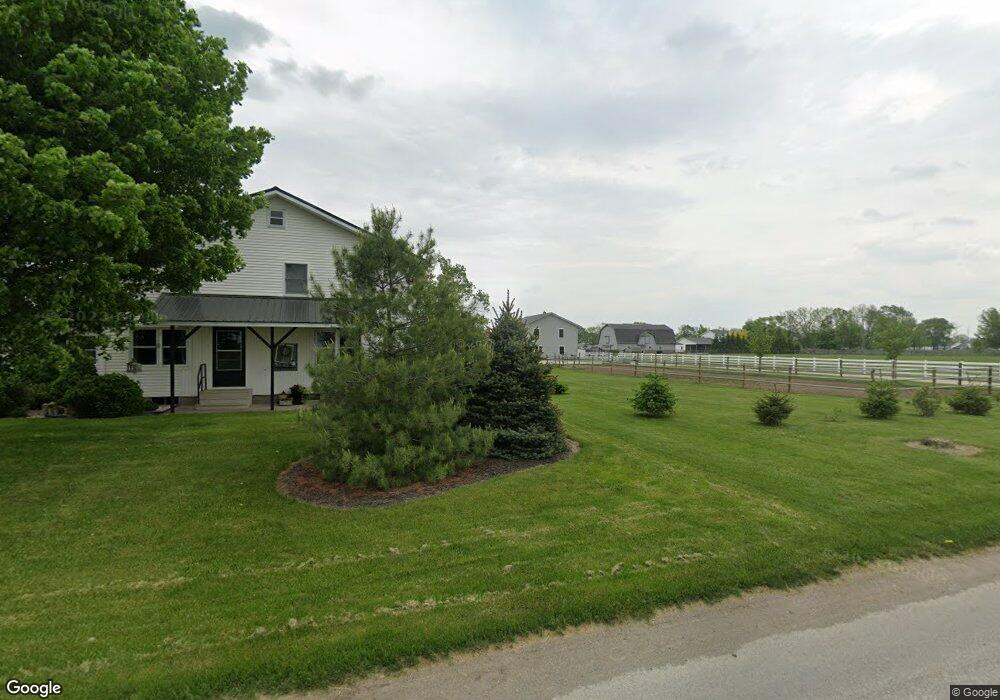
5655 S 675 W Topeka, IN 46571
Estimated Value: $259,000 - $717,000
5
Beds
2
Baths
2,100
Sq Ft
$246/Sq Ft
Est. Value
About This Home
This home is located at 5655 S 675 W, Topeka, IN 46571 and is currently estimated at $517,171, approximately $246 per square foot. 5655 S 675 W is a home located in LaGrange County with nearby schools including Topeka Elementary School, Westview Elementary School, and Westview Junior/Senior High School.
Ownership History
Date
Name
Owned For
Owner Type
Purchase Details
Closed on
Sep 30, 2020
Sold by
Mast Marvin S and Mast Esther S
Bought by
Troyer Arlin E and Troyer Loretta C
Current Estimated Value
Home Financials for this Owner
Home Financials are based on the most recent Mortgage that was taken out on this home.
Original Mortgage
$1,076,250
Outstanding Balance
$965,238
Interest Rate
3.37%
Mortgage Type
Construction
Estimated Equity
-$448,067
Create a Home Valuation Report for This Property
The Home Valuation Report is an in-depth analysis detailing your home's value as well as a comparison with similar homes in the area
Home Values in the Area
Average Home Value in this Area
Purchase History
| Date | Buyer | Sale Price | Title Company |
|---|---|---|---|
| Troyer Arlin E | $1,345,312 | Simplifile Lc E-Recording |
Source: Public Records
Mortgage History
| Date | Status | Borrower | Loan Amount |
|---|---|---|---|
| Open | Troyer Arlin E | $1,076,250 |
Source: Public Records
Tax History Compared to Growth
Tax History
| Year | Tax Paid | Tax Assessment Tax Assessment Total Assessment is a certain percentage of the fair market value that is determined by local assessors to be the total taxable value of land and additions on the property. | Land | Improvement |
|---|---|---|---|---|
| 2024 | $2,986 | $437,800 | $53,200 | $384,600 |
| 2023 | $2,841 | $428,900 | $49,100 | $379,800 |
| 2022 | $2,740 | $400,500 | $41,600 | $358,900 |
| 2021 | $2,561 | $358,700 | $38,600 | $320,100 |
| 2020 | $2,470 | $339,100 | $37,000 | $302,100 |
| 2019 | $2,489 | $338,300 | $39,200 | $299,100 |
| 2018 | $2,562 | $341,000 | $39,600 | $301,400 |
| 2017 | $2,537 | $340,600 | $41,500 | $299,100 |
| 2016 | $2,497 | $332,900 | $42,400 | $290,500 |
| 2014 | $1,322 | $187,500 | $39,300 | $148,200 |
| 2013 | $1,322 | $181,500 | $36,800 | $144,700 |
Source: Public Records
Map
Nearby Homes