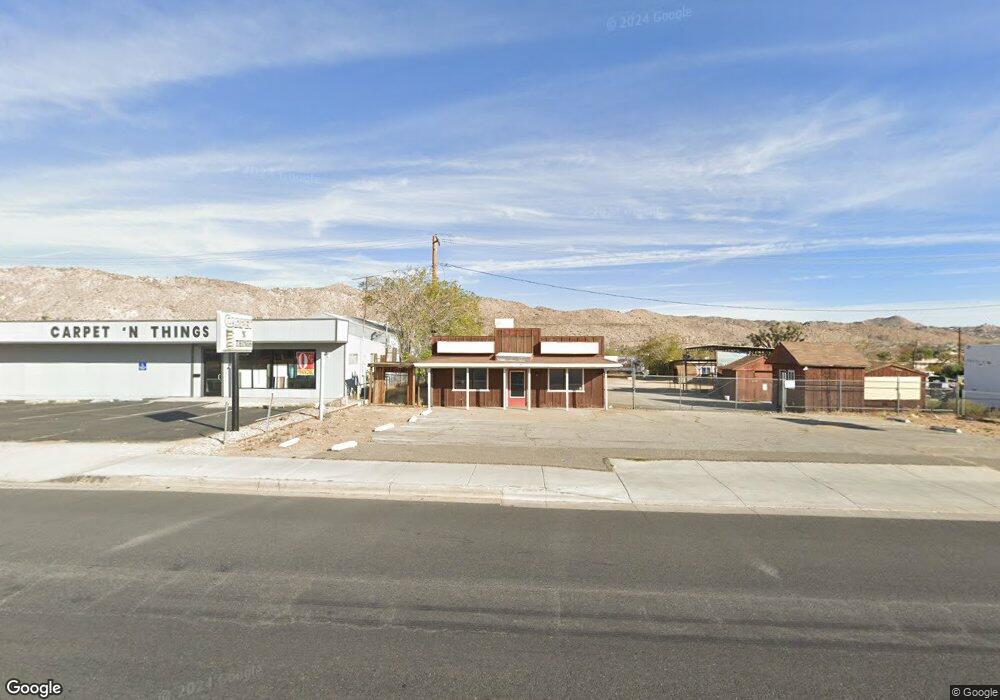
56560 Twentynine Palms Hwy Yucca Valley, CA 92284
Estimated Value: $601,693
--
Bed
--
Bath
1,200
Sq Ft
$501/Sq Ft
Est. Value
About This Home
This home is located at 56560 Twentynine Palms Hwy, Yucca Valley, CA 92284 and is currently estimated at $601,693, approximately $501 per square foot. 56560 Twentynine Palms Hwy is a home located in San Bernardino County with nearby schools including Yucca Valley Elementary School, La Contenta Middle School, and Yucca Valley High School.
Ownership History
Date
Name
Owned For
Owner Type
Purchase Details
Closed on
Mar 20, 2020
Sold by
Bradley David W and Bradley Debra J
Bought by
Vazquez Jose S and Vazquez Xochilt S
Current Estimated Value
Home Financials for this Owner
Home Financials are based on the most recent Mortgage that was taken out on this home.
Original Mortgage
$220,000
Outstanding Balance
$194,470
Interest Rate
3.4%
Mortgage Type
Commercial
Estimated Equity
$407,223
Purchase Details
Closed on
Nov 17, 2006
Sold by
Bradley David W
Bought by
Bradley David W and Bradley Debra J
Purchase Details
Closed on
Sep 2, 2005
Sold by
Ratliff Larry E
Bought by
Bradley David W and Bradley Debra J
Purchase Details
Closed on
May 4, 2005
Sold by
Mosley Dan
Bought by
Mosley Cheryl and Mcdowell James A
Purchase Details
Closed on
May 30, 2003
Sold by
Ratliff Larry E
Bought by
Ratliff Larry E and Ratliff Patti
Create a Home Valuation Report for This Property
The Home Valuation Report is an in-depth analysis detailing your home's value as well as a comparison with similar homes in the area
Home Values in the Area
Average Home Value in this Area
Purchase History
| Date | Buyer | Sale Price | Title Company |
|---|---|---|---|
| Vazquez Jose S | $360,000 | Chicago Title Company | |
| Bradley David W | -- | None Available | |
| Bradley David W | $200,000 | First American | |
| Mosley Cheryl | -- | First American | |
| Ratliff Larry E | -- | -- | |
| Ratliff Larry | -- | -- |
Source: Public Records
Mortgage History
| Date | Status | Borrower | Loan Amount |
|---|---|---|---|
| Open | Vazquez Jose S | $220,000 |
Source: Public Records
Tax History Compared to Growth
Tax History
| Year | Tax Paid | Tax Assessment Tax Assessment Total Assessment is a certain percentage of the fair market value that is determined by local assessors to be the total taxable value of land and additions on the property. | Land | Improvement |
|---|---|---|---|---|
| 2025 | $5,095 | $393,714 | $229,666 | $164,048 |
| 2024 | $5,095 | $385,994 | $225,163 | $160,831 |
| 2023 | $4,921 | $378,425 | $220,748 | $157,677 |
| 2022 | $4,835 | $371,005 | $216,420 | $154,585 |
| 2021 | $4,932 | $363,730 | $212,176 | $151,554 |
| 2020 | $4,440 | $314,893 | $224,922 | $89,971 |
| 2019 | $4,643 | $308,719 | $220,512 | $88,207 |
| 2018 | $4,300 | $302,665 | $216,188 | $86,477 |
| 2017 | $3,900 | $296,730 | $211,949 | $84,781 |
| 2016 | $3,829 | $290,912 | $207,793 | $83,119 |
| 2015 | $3,746 | $286,542 | $204,672 | $81,870 |
| 2014 | $3,711 | $280,929 | $200,663 | $80,266 |
Source: Public Records
Map
Nearby Homes
- 56565 Antelope Trail
- 56646 Antelope Trail
- 0 Antelope Trail Unit OC24084101
- 56637 Desert Vista Cir
- 7344 Palm Ave
- 0 Cassia Dr Unit HD24234322
- 7408 Desert Sky Dr
- 7420 Desert Sky Dr
- 7199 Grand Ave
- 7432 Desert Sky Dr
- 7444 Desert Sky Dr
- 7120 Cholla Ave
- 7425 Church St Unit 126
- 7425 Church St Unit 61
- 7425 Church St Unit 67
- 7425 Church St Unit 149
- 7425 Church St Unit 134
- 7425 Church St Unit 111
- 7425 Church St Unit 82
- 7425 Church St Unit 59
- 56560 29 Palms Hwy
- 56546 Twentynine Palms Hwy
- 56567 Twentynine Palms Hwy
- 56592 29 Palms Hwy
- 56592 29 Palms Hwy
- 56592 29 Palms Hwy Unit r
- 56592 29 Palms Hwy Unit A
- 56504 29 Palms Hwy
- 56504 Twentynine Palms Hwy
- 56608 Twentynine Palms Hwy
- 56569 Twentynine Palms Hwy
- 7251 Palm Ave
- 0 Twentynine Palms Hwy Unit IV18210566
- 0 Twentynine Palms Hwy Unit JT18195016
- 0 Twentynine Palms Hwy Unit JT18190739
- 0 Twentynine Palms Hwy Unit JT18174190
- 0 Twentynine Palms Hwy Unit IV18087993
- 0 Twentynine Palms Hwy Unit DC21126533
- 0 Twentynine Palms Hwy Unit CC263845
- 0 Twentynine Palms Hwy Unit I08157549