M
Seller's Agent in 2025
Mandy Ducote
Berkshire Hathaway HomeServices Ally Real Estate
(225) 803-9277
2 in this area
6 Total Sales
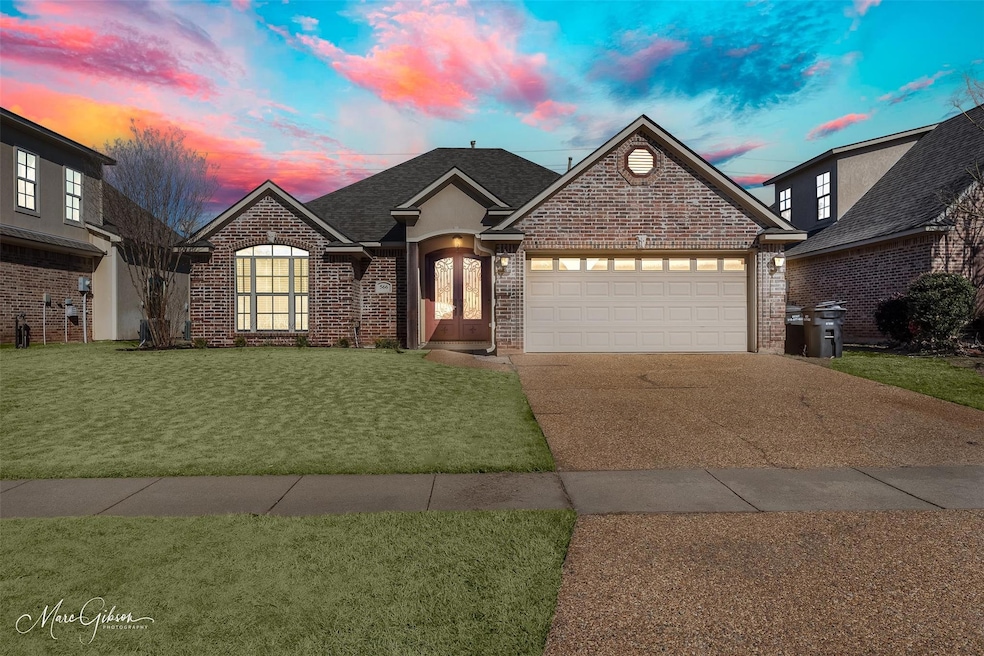


Welcome home to 566 Chinquipin Drive in Cypress Bend, a family-friendly gated community in North Bossier! This lovely 3 bedroom, 2 bath home offers 1,641 square feet of living space and a split floor plan ideal for families. The kitchen boasts of granite countertops, an island for added work space, modern stainless steel appliances, and an extra-large dining area. Gleaming hardwood floors, high ceilings, and a cozy gas-burning fireplace make the living room warm and inviting. You'll enjoy the convenience of ceramic tile in the kitchen and bathrooms, as well as the comfort of plush carpeting in the bedrooms. The open floor plan is perfect for entertaining family and friends, and a covered patio expands your entertaining options to the outdoors and your fully fenced backyard.
Cypress Bend is conveniently located near top-rated schools with quick access to shopping and restaurants. With a family-friendly culture, brand new playground, and neighborhood events like food truck nights, this is a highly sought after community! Don't miss out on the opportunity to make this beautiful home your own!
Last Agent to Sell the Property
Berkshire Hathaway HomeServices Ally Real Estate Brokerage Phone: 318-231-2000 License #0995716363 Listed on: 01/24/2025

| Date | Type | Sale Price | Title Company |
|---|---|---|---|
| Deed | $275,000 | None Listed On Document | |
| Deed | $278,000 | None Listed On Document | |
| Deed | $205,650 | None Available |
| Date | Status | Loan Amount | Loan Type |
|---|---|---|---|
| Open | $233,750 | New Conventional | |
| Previous Owner | $268,061 | Construction | |
| Previous Owner | $202,970 | FHA |
| Date | Event | Price | Change | Sq Ft Price |
|---|---|---|---|---|
| 08/25/2025 08/25/25 | Sold | -- | -- | -- |
| 08/11/2025 08/11/25 | Pending | -- | -- | -- |
| 07/18/2025 07/18/25 | Price Changed | $275,000 | -3.5% | $168 / Sq Ft |
| 06/12/2025 06/12/25 | Price Changed | $285,000 | -1.7% | $174 / Sq Ft |
| 05/04/2025 05/04/25 | Price Changed | $289,900 | -1.7% | $177 / Sq Ft |
| 03/18/2025 03/18/25 | Price Changed | $294,900 | -1.7% | $180 / Sq Ft |
| 01/24/2025 01/24/25 | For Sale | $299,900 | +5.2% | $183 / Sq Ft |
| 09/13/2023 09/13/23 | Sold | -- | -- | -- |
| 08/04/2023 08/04/23 | Pending | -- | -- | -- |
| 07/05/2023 07/05/23 | Price Changed | $284,999 | -3.4% | $174 / Sq Ft |
| 06/05/2023 06/05/23 | Price Changed | $294,999 | -1.6% | $180 / Sq Ft |
| 05/31/2023 05/31/23 | Price Changed | $299,900 | 0.0% | $183 / Sq Ft |
| 04/26/2023 04/26/23 | For Sale | $299,999 | -- | $183 / Sq Ft |
| Year | Tax Paid | Tax Assessment Tax Assessment Total Assessment is a certain percentage of the fair market value that is determined by local assessors to be the total taxable value of land and additions on the property. | Land | Improvement |
|---|---|---|---|---|
| 2024 | $2,227 | $25,242 | $4,000 | $21,242 |
| 2023 | $2,775 | $20,892 | $3,570 | $17,322 |
| 2022 | $1,783 | $20,892 | $3,570 | $17,322 |
| 2021 | $1,756 | $20,892 | $3,570 | $17,322 |
| 2020 | $1,756 | $20,892 | $3,570 | $17,322 |
| 2019 | $1,719 | $20,438 | $3,100 | $17,338 |
| 2018 | $1,720 | $20,440 | $3,100 | $17,340 |
| 2017 | $1,700 | $20,440 | $3,100 | $17,340 |
| 2016 | $1,700 | $20,440 | $3,100 | $17,340 |
| 2015 | $1,615 | $20,510 | $3,100 | $17,410 |
| 2014 | $1,613 | $20,510 | $3,100 | $17,410 |
M
Seller's Agent in 2025
Mandy Ducote
Berkshire Hathaway HomeServices Ally Real Estate
(225) 803-9277
2 in this area
6 Total Sales
J
Buyer's Agent in 2025
Jessica Johnson
Diamond Realty & Associates
(318) 617-0179
1 in this area
4 Total Sales
Seller's Agent in 2023
Nick Herzog
Homesmart Realty South
(318) 678-3181
24 in this area
238 Total Sales
P
Buyer's Agent in 2023
Penny Warner
Pinnacle Realty Advisors
(318) 518-4799
3 in this area
19 Total Sales
Source: North Texas Real Estate Information Systems (NTREIS)
MLS Number: 20824914
APN: 167025
Disclaimer: Certain information contained herein is derived from information provided by parties other than Homes.com. All information provided is deemed reliable, but is not guaranteed to be accurate and should be independently verified.
![]() Listing information provided in part by the North Texas Real Estate Information Systems, Inc, for personal, non-commercial use by viewers of this site and may not be reproduced or redistributed. All information is deemed reliable but not guaranteed. Copyright © NTREIS 2025. All rights reserved
Listing information provided in part by the North Texas Real Estate Information Systems, Inc, for personal, non-commercial use by viewers of this site and may not be reproduced or redistributed. All information is deemed reliable but not guaranteed. Copyright © NTREIS 2025. All rights reserved