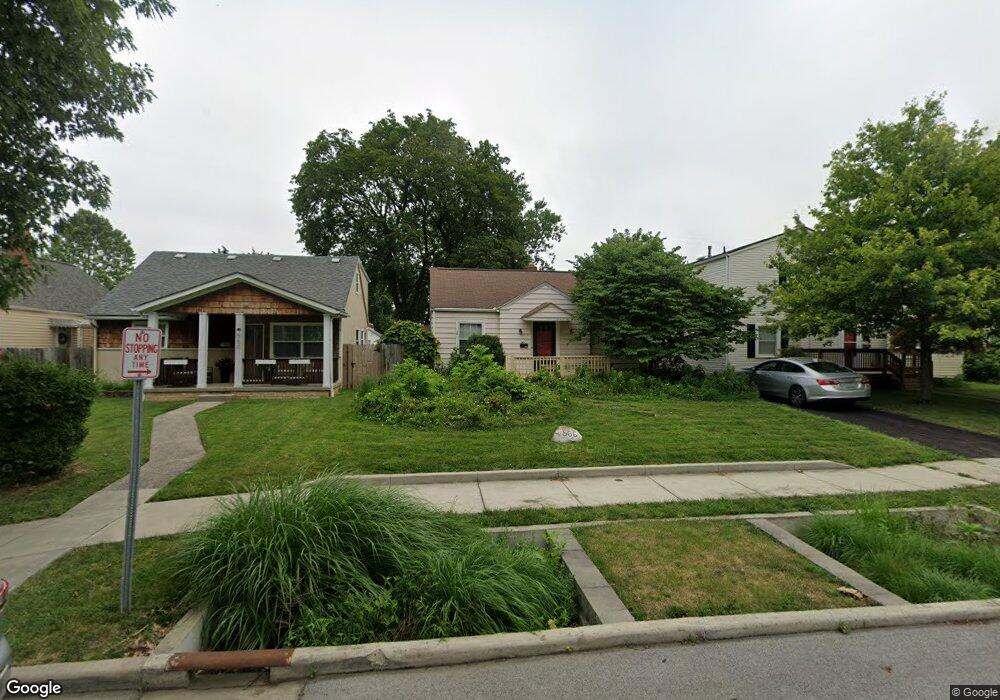
566 E Royal Forest Blvd Columbus, OH 43214
Clintonville NeighborhoodEstimated Value: $275,614 - $298,000
2
Beds
2
Baths
776
Sq Ft
$369/Sq Ft
Est. Value
About This Home
This home is located at 566 E Royal Forest Blvd, Columbus, OH 43214 and is currently estimated at $286,404, approximately $369 per square foot. 566 E Royal Forest Blvd is a home located in Franklin County with nearby schools including Colerain Elementary School, Dominion Middle School, and Whetstone High School.
Ownership History
Date
Name
Owned For
Owner Type
Purchase Details
Closed on
Oct 7, 2006
Sold by
Rowe Matthew T
Bought by
Oswald Virginia M
Current Estimated Value
Home Financials for this Owner
Home Financials are based on the most recent Mortgage that was taken out on this home.
Original Mortgage
$123,190
Outstanding Balance
$72,101
Interest Rate
6.49%
Mortgage Type
Purchase Money Mortgage
Estimated Equity
$214,303
Purchase Details
Closed on
Oct 27, 1998
Sold by
Anderson April Marie and Davidson April Marie
Bought by
Rowe Matthew T
Home Financials for this Owner
Home Financials are based on the most recent Mortgage that was taken out on this home.
Original Mortgage
$69,570
Interest Rate
11%
Purchase Details
Closed on
Oct 21, 1998
Sold by
Davidson Robert J and Davidson Bruce M
Bought by
Rowe Matthew T
Home Financials for this Owner
Home Financials are based on the most recent Mortgage that was taken out on this home.
Original Mortgage
$69,570
Interest Rate
11%
Create a Home Valuation Report for This Property
The Home Valuation Report is an in-depth analysis detailing your home's value as well as a comparison with similar homes in the area
Home Values in the Area
Average Home Value in this Area
Purchase History
| Date | Buyer | Sale Price | Title Company |
|---|---|---|---|
| Oswald Virginia M | $127,000 | New Century | |
| Rowe Matthew T | $11,600 | -- | |
| Rowe Matthew T | $65,700 | -- |
Source: Public Records
Mortgage History
| Date | Status | Borrower | Loan Amount |
|---|---|---|---|
| Open | Oswald Virginia M | $123,190 | |
| Previous Owner | Rowe Matthew T | $69,570 |
Source: Public Records
Tax History
| Year | Tax Paid | Tax Assessment Tax Assessment Total Assessment is a certain percentage of the fair market value that is determined by local assessors to be the total taxable value of land and additions on the property. | Land | Improvement |
|---|---|---|---|---|
| 2025 | $3,977 | $88,620 | $41,300 | $47,320 |
| 2024 | $3,977 | $88,620 | $41,300 | $47,320 |
| 2023 | $3,926 | $88,620 | $41,300 | $47,320 |
| 2022 | $3,360 | $64,790 | $25,030 | $39,760 |
| 2021 | $3,433 | $64,790 | $25,030 | $39,760 |
| 2020 | $3,371 | $64,790 | $25,030 | $39,760 |
| 2019 | $3,036 | $50,050 | $19,250 | $30,800 |
| 2018 | $2,733 | $50,050 | $19,250 | $30,800 |
| 2017 | $2,859 | $50,050 | $19,250 | $30,800 |
| 2016 | $2,683 | $40,500 | $16,100 | $24,400 |
| 2015 | $2,435 | $40,500 | $16,100 | $24,400 |
| 2014 | $2,441 | $40,500 | $16,100 | $24,400 |
| 2013 | $1,147 | $38,570 | $15,330 | $23,240 |
Source: Public Records
Map
Nearby Homes
- 522 E Beechwold Blvd
- 327 E Jeffrey Place
- 4615 Glenmawr Ave
- 4605 Glenmawr Ave
- 4450 N 4th St
- 827 Inwood Place
- 103 E Jeffrey Place
- 4231 Glenmawr Ave Unit 233
- 243 E Schreyer Place
- 899 Meadowview Dr
- 4320 Sandy Lane Rd
- 151 W Dominion Blvd
- 62 W Rathbone Ave
- 5301 Indianola Ave
- 4737 Maize Rd
- 1130 Carbone Dr
- 468 E Lincoln Ave
- 952 Minerva Ave
- 5364 Stock Rd
- 627 S Selby Blvd
- 572 E Royal Forest Blvd
- 560 E Royal Forest Blvd
- 556 E Royal Forest Blvd
- 576 E Royal Forest Blvd
- 550 E Royal Forest Blvd
- 580 E Royal Forest Blvd
- 567 E Jeffrey Place
- 571 E Jeffrey Place
- 559 E Jeffrey Place
- 544 E Royal Forest Blvd
- 586 E Royal Forest Blvd
- 575 E Jeffrey Place
- 553 E Jeffrey Place
- 563 E Royal Forest Blvd
- 557 E Royal Forest Blvd
- 581 E Jeffrey Place
- 571 E Royal Forest Blvd
- 549 E Jeffrey Place
- 553 E Royal Forest Blvd
- 538 E Royal Forest Blvd
Your Personal Tour Guide
Ask me questions while you tour the home.