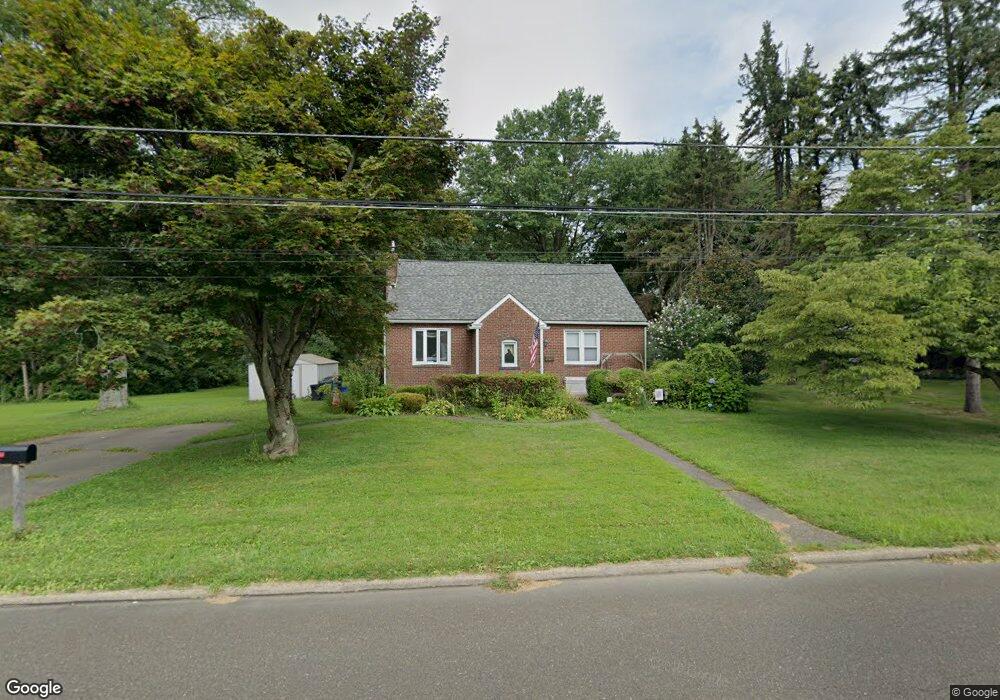
566 Kutcher Rd Southampton, PA 18966
Estimated Value: $375,000 - $477,566
3
Beds
1
Bath
1,697
Sq Ft
$243/Sq Ft
Est. Value
About This Home
This home is located at 566 Kutcher Rd, Southampton, PA 18966 and is currently estimated at $412,642, approximately $243 per square foot. 566 Kutcher Rd is a home located in Bucks County with nearby schools including Davis Elementary School, Klinger Middle School, and William Tennent High School.
Ownership History
Date
Name
Owned For
Owner Type
Purchase Details
Closed on
Aug 10, 2022
Sold by
Capps John M and Capps Anne M
Bought by
Capps John M
Current Estimated Value
Purchase Details
Closed on
Jun 12, 2013
Sold by
Capps John M and Capps Anne Marie
Bought by
Capps John M and Capps Anne Marie
Purchase Details
Closed on
Apr 30, 2008
Sold by
Davis David L and Davis Janine M
Bought by
Capps John M and Capps Anne M
Home Financials for this Owner
Home Financials are based on the most recent Mortgage that was taken out on this home.
Original Mortgage
$175,000
Interest Rate
5.99%
Mortgage Type
Unknown
Purchase Details
Closed on
Sep 16, 1995
Sold by
York Barry D and York Karen P
Bought by
Davis David L and Davis Janine M
Home Financials for this Owner
Home Financials are based on the most recent Mortgage that was taken out on this home.
Original Mortgage
$112,500
Interest Rate
7.89%
Create a Home Valuation Report for This Property
The Home Valuation Report is an in-depth analysis detailing your home's value as well as a comparison with similar homes in the area
Home Values in the Area
Average Home Value in this Area
Purchase History
| Date | Buyer | Sale Price | Title Company |
|---|---|---|---|
| Capps John M | $91,598 | Dischell Bartle & Dooley | |
| Capps John M | -- | None Available | |
| Capps John M | $55,000 | None Available | |
| Capps John M | $250,000 | None Available | |
| Davis David L | $125,000 | -- |
Source: Public Records
Mortgage History
| Date | Status | Borrower | Loan Amount |
|---|---|---|---|
| Previous Owner | Capps John M | $175,000 | |
| Previous Owner | Davis David L | $112,500 |
Source: Public Records
Tax History Compared to Growth
Tax History
| Year | Tax Paid | Tax Assessment Tax Assessment Total Assessment is a certain percentage of the fair market value that is determined by local assessors to be the total taxable value of land and additions on the property. | Land | Improvement |
|---|---|---|---|---|
| 2025 | $4,892 | $22,870 | $9,320 | $13,550 |
| 2024 | $4,892 | $22,870 | $9,320 | $13,550 |
| 2023 | $4,743 | $22,870 | $9,320 | $13,550 |
| 2022 | $4,643 | $22,870 | $9,320 | $13,550 |
| 2021 | $4,559 | $22,870 | $9,320 | $13,550 |
| 2020 | $4,496 | $22,870 | $9,320 | $13,550 |
| 2019 | $4,331 | $22,870 | $9,320 | $13,550 |
| 2018 | $4,231 | $22,870 | $9,320 | $13,550 |
| 2017 | $4,111 | $22,870 | $9,320 | $13,550 |
| 2016 | $4,111 | $22,870 | $9,320 | $13,550 |
| 2015 | -- | $22,870 | $9,320 | $13,550 |
| 2014 | -- | $22,870 | $9,320 | $13,550 |
Source: Public Records
Map
Nearby Homes
- 1307 Steamboat Station Unit 1307
- 693 Provident Rd
- 681 Provident Rd
- 932 Rozel Ave
- 736 Plum St
- 926 Carlin Dr
- 643 Croft Dr
- 634 Nicole Dr
- 247 Gravel Hill Rd
- 1632 Mcnelis Dr
- 615 Belmont Ave
- 1535 Fieldwood Rd
- 905 Pebble Ln
- 1555 Fieldwood Rd
- 521 Jason Dr
- 561 Zinn Dr
- 415 New Rd
- 721 Grantham Ct
- 1581 Heather Rd
- 1811 Hennessy Dr
- 578 Kutcher Rd
- 571 Kutcher Rd
- 555 Kutcher Rd
- 548 Kutcher Rd
- 581 Kutcher Rd
- 588 Kutcher Rd
- 545 Kutcher Rd
- 534 Kutcher Rd
- 598 Kutcher Rd
- 595 Kutcher Rd
- 524 Kutcher Rd
- 610 Kutcher Rd
- 515 Kutcher Rd
- 611 Kutcher Rd
- 541 Cushmore Rd
- 547 Cushmore Rd
- 553 Cushmore Rd
- 531 Cushmore Rd
- 1027 Rozel Ave
- 561 Cushmore Rd