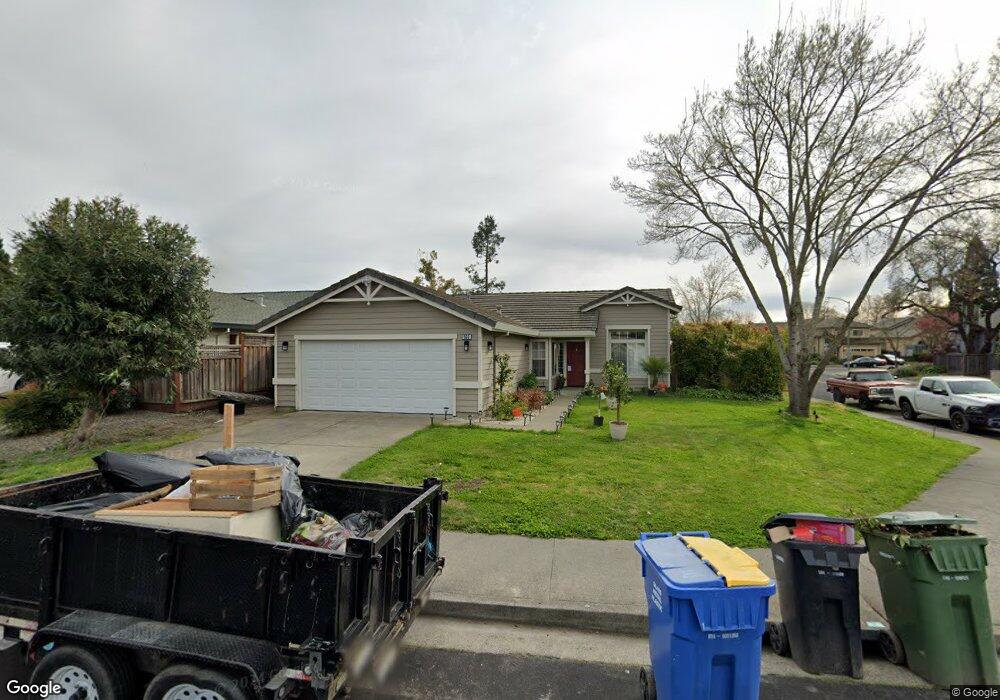
566 Leafhaven Ln Windsor, CA 95492
Estimated Value: $645,212 - $751,000
3
Beds
2
Baths
1,165
Sq Ft
$585/Sq Ft
Est. Value
About This Home
This home is located at 566 Leafhaven Ln, Windsor, CA 95492 and is currently estimated at $681,803, approximately $585 per square foot. 566 Leafhaven Ln is a home located in Sonoma County with nearby schools including Mattie Washburn Elementary School, Brooks Elementary School, and Windsor Middle School.
Ownership History
Date
Name
Owned For
Owner Type
Purchase Details
Closed on
Nov 10, 2017
Sold by
Buonanno Fred R and Mckelvey Heather
Bought by
Buonanno Fred R and Mckelvey Heather
Current Estimated Value
Purchase Details
Closed on
Jun 7, 2010
Sold by
Boies John G and Boies Michelle L
Bought by
Buonanno Fred R and Mckelvey Heather
Home Financials for this Owner
Home Financials are based on the most recent Mortgage that was taken out on this home.
Original Mortgage
$226,814
Outstanding Balance
$152,458
Interest Rate
5.03%
Mortgage Type
Purchase Money Mortgage
Estimated Equity
$529,345
Purchase Details
Closed on
Aug 31, 2006
Sold by
Boies John G and Boies Michelle L
Bought by
Boies John G and Boies Michelle L
Purchase Details
Closed on
Aug 12, 1992
Sold by
Kaufman & Broad South Bay Inc
Bought by
Barnes Boies John Galen and Barnes Boies Michelle
Home Financials for this Owner
Home Financials are based on the most recent Mortgage that was taken out on this home.
Original Mortgage
$155,650
Interest Rate
7.67%
Create a Home Valuation Report for This Property
The Home Valuation Report is an in-depth analysis detailing your home's value as well as a comparison with similar homes in the area
Home Values in the Area
Average Home Value in this Area
Purchase History
| Date | Buyer | Sale Price | Title Company |
|---|---|---|---|
| Buonanno Fred R | -- | None Available | |
| Buonanno Fred R | $290,000 | First American Title Company | |
| Boies John G | -- | None Available | |
| Boies John G | -- | None Available | |
| Barnes Boies John Galen | $173,000 | First American Title |
Source: Public Records
Mortgage History
| Date | Status | Borrower | Loan Amount |
|---|---|---|---|
| Open | Buonanno Fred R | $226,814 | |
| Previous Owner | Barnes Boies John Galen | $155,650 |
Source: Public Records
Tax History
| Year | Tax Paid | Tax Assessment Tax Assessment Total Assessment is a certain percentage of the fair market value that is determined by local assessors to be the total taxable value of land and additions on the property. | Land | Improvement |
|---|---|---|---|---|
| 2025 | $4,615 | $374,326 | $154,892 | $219,434 |
| 2024 | $4,615 | $366,987 | $151,855 | $215,132 |
| 2023 | $4,615 | $359,792 | $148,878 | $210,914 |
| 2022 | $4,454 | $352,738 | $145,959 | $206,779 |
| 2021 | $4,385 | $345,823 | $143,098 | $202,725 |
| 2020 | $4,479 | $342,278 | $141,631 | $200,647 |
| 2019 | $4,443 | $335,567 | $138,854 | $196,713 |
| 2018 | $4,411 | $328,988 | $136,132 | $192,856 |
| 2017 | $4,371 | $322,538 | $133,463 | $189,075 |
| 2016 | $4,088 | $316,215 | $130,847 | $185,368 |
| 2015 | $3,979 | $311,466 | $128,882 | $182,584 |
| 2014 | $3,924 | $305,366 | $126,358 | $179,008 |
Source: Public Records
Map
Nearby Homes
- 719 Hackberry Ct
- 1276 Jensen Ln Unit LOT 2
- 1276 Jensen Ln Unit LOT 1
- 1276 Jensen Ln Unit LOT 3
- 349 Sugar Maple Ln
- 365 Alden Ct
- 155 Amanda Way
- 159 Amanda Way
- 145 Amanda Way
- 149 Amanda Way
- 127 Pleasant Ave
- 9636 Lakewood Dr
- 203 Cockrobin Ave
- 179 Pleasant Ave
- 327 Blazing Star Ct
- 230 Courtyards E
- 106 Courtyards E
- 6516 Hwy
- 172 Cornell St
- 156 Cornell St
- 572 Leafhaven Ln
- 571 Shagbark St
- 577 Shagbark St
- 578 Leafhaven Ln
- 548 Leafhaven Ln
- 583 Shagbark St
- 569 Leafhaven Ln
- 563 Shagbark St
- 563 Leafhaven Ln
- 575 Leafhaven Ln
- 589 Shagbark St
- 584 Leafhaven Ln
- 557 Leafhaven Ln
- 557 Shagbark St
- 542 Leafhaven Ln
- 551 Leafhaven Ln
- 701 Willowood Way
- 595 Shagbark St
- 590 Leafhaven Ln
- 578 Pistachio Place
Your Personal Tour Guide
Ask me questions while you tour the home.