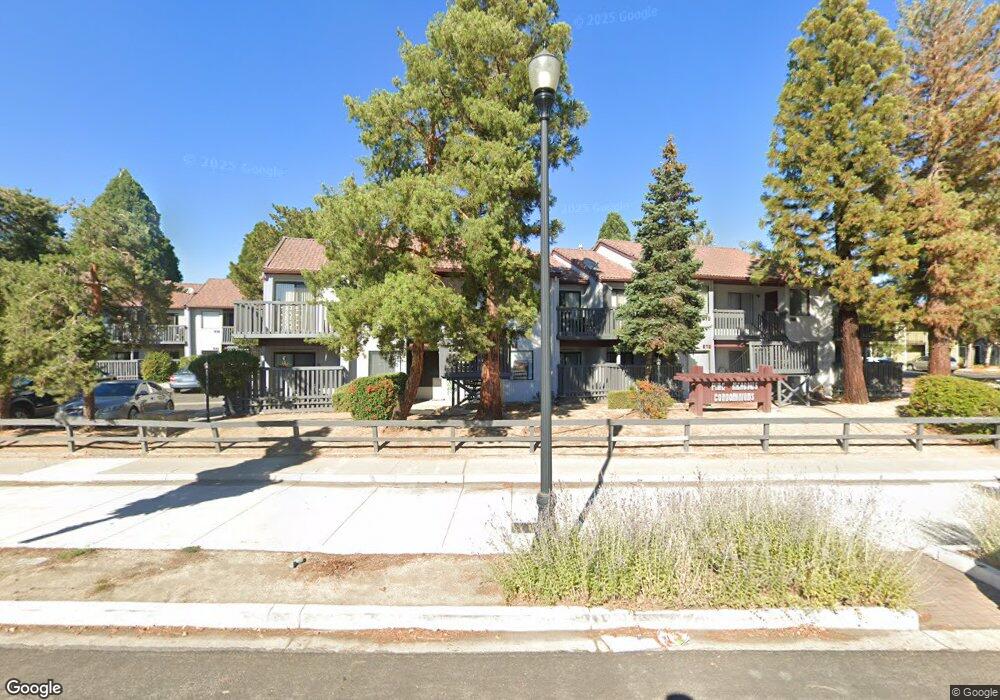
566 Nichols Blvd Unit 6 Sparks, NV 89431
McCarran Boulevard-Probasco NeighborhoodEstimated Value: $201,652 - $272,000
1
Bed
1
Bath
682
Sq Ft
$343/Sq Ft
Est. Value
About This Home
This home is located at 566 Nichols Blvd Unit 6, Sparks, NV 89431 and is currently estimated at $233,663, approximately $342 per square foot. 566 Nichols Blvd Unit 6 is a home located in Washoe County with nearby schools including Lincoln Park Elementary School, George L Dilworth Middle School, and Sparks High School.
Ownership History
Date
Name
Owned For
Owner Type
Purchase Details
Closed on
Jul 25, 2008
Sold by
Neighbors Adriana M and Neighbors Douglas Norma
Bought by
Kasimatis Araceli Mendoza
Current Estimated Value
Purchase Details
Closed on
Aug 15, 2005
Sold by
Fry Robert
Bought by
Neighbors Adriana M and Neighbors Douglas Norma
Home Financials for this Owner
Home Financials are based on the most recent Mortgage that was taken out on this home.
Original Mortgage
$106,400
Interest Rate
5.48%
Mortgage Type
Fannie Mae Freddie Mac
Purchase Details
Closed on
Jul 26, 2005
Sold by
Douglas Brent N
Bought by
Douglas Norma Raquel
Home Financials for this Owner
Home Financials are based on the most recent Mortgage that was taken out on this home.
Original Mortgage
$106,400
Interest Rate
5.48%
Mortgage Type
Fannie Mae Freddie Mac
Create a Home Valuation Report for This Property
The Home Valuation Report is an in-depth analysis detailing your home's value as well as a comparison with similar homes in the area
Home Values in the Area
Average Home Value in this Area
Purchase History
| Date | Buyer | Sale Price | Title Company |
|---|---|---|---|
| Kasimatis Araceli Mendoza | $124,000 | First Centennial Reno | |
| Neighbors Adriana M | $133,000 | First Centennial Title Co | |
| Fry Robert | -- | First Centennial Title Co | |
| Douglas Norma Raquel | -- | First Centennial Title Co |
Source: Public Records
Mortgage History
| Date | Status | Borrower | Loan Amount |
|---|---|---|---|
| Previous Owner | Neighbors Adriana M | $106,400 |
Source: Public Records
Tax History Compared to Growth
Tax History
| Year | Tax Paid | Tax Assessment Tax Assessment Total Assessment is a certain percentage of the fair market value that is determined by local assessors to be the total taxable value of land and additions on the property. | Land | Improvement |
|---|---|---|---|---|
| 2025 | $670 | $31,284 | $17,185 | $14,099 |
| 2024 | $670 | $31,001 | $16,100 | $14,901 |
| 2023 | $621 | $27,704 | $14,385 | $13,319 |
| 2022 | $575 | $20,627 | $8,995 | $11,632 |
| 2021 | $1,026 | $18,829 | $7,070 | $11,759 |
| 2020 | $498 | $19,051 | $7,070 | $11,981 |
| 2019 | $474 | $16,417 | $4,585 | $11,832 |
| 2018 | $453 | $15,584 | $3,885 | $11,699 |
| 2017 | $434 | $15,628 | $3,885 | $11,743 |
| 2016 | $425 | $16,079 | $3,885 | $12,194 |
| 2015 | $319 | $14,919 | $3,010 | $11,909 |
| 2014 | $412 | $14,792 | $2,660 | $12,132 |
| 2013 | -- | $13,529 | $1,820 | $11,709 |
Source: Public Records
Map
Nearby Homes
- 445 Pine Meadows Dr Unit E25
- 560 Nichols Blvd
- 601 Oakwood Dr Unit 4
- 360 E Lincoln Way
- 611 Oakwood Dr Unit 1
- 604 Oakwood Dr Unit 1
- 644 Oakwood Dr Unit 2
- 684 Oakwood Dr Unit 3
- 10 Lincoln Way
- 907 Camino Real Dr
- 801 Woodglen Dr Unit 2
- 848 Parkside Dr Unit 1
- 385 Gleeson Way
- 400 4th St
- 324 Victorian Ave
- 949 Crestwood Dr Unit 3
- 857 Cherry Tree Dr Unit 3
- 370 O'Brien Way
- 402 5th St
- 300 I St
- 554 Nichols Blvd Unit 5
- 572 Nichols Blvd
- 548 Nichols Blvd Unit 1
- 578 Nichols Blvd
- 590 Nichols Blvd Unit 8
- 584 Nichols Blvd
- 536 Nichols Blvd
- 542 Nichols Blvd Unit A
- 542 Nichols Blvd Unit 8
- 530 Nichols Blvd Unit 7
- 524 Nichols Blvd Unit 3
- 512 Nichols Blvd Unit 2
- 518 Nichols Blvd Unit 6
- 500 Nichols Blvd Unit 1
- 506 Nichols Blvd Unit 5
- 435 Pine Meadows Dr Unit A
- 435 Pine Meadows Dr Unit 8
- 435 Pine Meadows Dr Unit 7
- 435 Pine Meadows Dr Unit 6
- 435 Pine Meadows Dr Unit 5