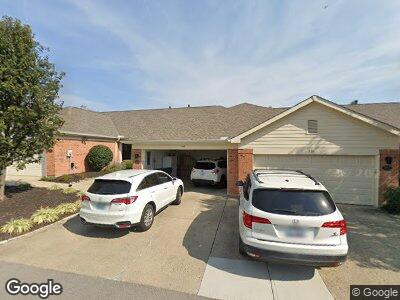
566 Palmer Ct Crestview Hills, KY 41017
Crestview Hills NeighborhoodEstimated Value: $369,000
2
Beds
3
Baths
1,368
Sq Ft
$270/Sq Ft
Est. Value
About This Home
This home is located at 566 Palmer Ct, Crestview Hills, KY 41017 and is currently priced at $369,000, approximately $269 per square foot. 566 Palmer Ct is a home located in Kenton County with nearby schools including Hinsdale Elementary School, Turkey Foot Middle School, and Dixie Heights High School.
Ownership History
Date
Name
Owned For
Owner Type
Purchase Details
Closed on
Dec 8, 2020
Sold by
Corken Paul G
Bought by
Corken Mary E
Current Estimated Value
Home Financials for this Owner
Home Financials are based on the most recent Mortgage that was taken out on this home.
Original Mortgage
$206,900
Outstanding Balance
$186,880
Interest Rate
2.75%
Mortgage Type
New Conventional
Estimated Equity
$212,520
Purchase Details
Closed on
Oct 23, 2015
Sold by
Blymyer Lois J
Bought by
Corken Paul G and The Mary E Corken Trust D
Home Financials for this Owner
Home Financials are based on the most recent Mortgage that was taken out on this home.
Original Mortgage
$205,600
Interest Rate
2.62%
Mortgage Type
Adjustable Rate Mortgage/ARM
Purchase Details
Closed on
May 8, 1996
Sold by
Erpenbeck Anthony
Bought by
Blymyer Clifford C and Blymyer Lois
Home Financials for this Owner
Home Financials are based on the most recent Mortgage that was taken out on this home.
Original Mortgage
$146,100
Interest Rate
6.88%
Mortgage Type
New Conventional
Create a Home Valuation Report for This Property
The Home Valuation Report is an in-depth analysis detailing your home's value as well as a comparison with similar homes in the area
Home Values in the Area
Average Home Value in this Area
Purchase History
| Date | Buyer | Sale Price | Title Company |
|---|---|---|---|
| Corken Mary E | -- | None Available | |
| Corken Paul G | $257,500 | Attorney | |
| Blymyer Clifford C | $182,681 | -- |
Source: Public Records
Mortgage History
| Date | Status | Borrower | Loan Amount |
|---|---|---|---|
| Open | Corken Mary E | $206,900 | |
| Closed | Corken Paul G | $205,600 | |
| Previous Owner | Blymyer Lois G | $214,785 | |
| Previous Owner | Blymyer Clifford C | $224,062 | |
| Previous Owner | Blymyer Clifford C | $45,000 | |
| Previous Owner | Blymyer Clifford C | $146,100 |
Source: Public Records
Tax History Compared to Growth
Tax History
| Year | Tax Paid | Tax Assessment Tax Assessment Total Assessment is a certain percentage of the fair market value that is determined by local assessors to be the total taxable value of land and additions on the property. | Land | Improvement |
|---|---|---|---|---|
| 2023 | $2,365 | $268,300 | $50,000 | $218,300 |
| 2022 | $2,513 | $268,300 | $50,000 | $218,300 |
| 2021 | $2,565 | $268,300 | $50,000 | $218,300 |
| 2020 | $2,606 | $268,300 | $50,000 | $218,300 |
| 2019 | $2,494 | $257,500 | $50,000 | $207,500 |
| 2018 | $2,520 | $257,500 | $50,000 | $207,500 |
| 2017 | $2,450 | $257,500 | $50,000 | $207,500 |
| 2015 | $1,878 | $210,000 | $50,000 | $160,000 |
| 2014 | $1,856 | $210,000 | $50,000 | $160,000 |
Source: Public Records
Map
Nearby Homes
- 561 Napa Valley Ln Unit 10
- Lot 4 Ambrosia Way
- 263 N Ashbrook Cir
- 2979 Fallen Tree Ct
- 2983 Ambrosia Way Unit Lot 3
- Lot 5 Ambrosia Way
- 2 Ambrosia Way
- 2912 University Cir
- 111 Beech Dr
- 3017 Edge Mar Dr
- 2678 van Deren Dr
- 8 Whitehouse Dr
- 2645 van Deren Dr
- 137 Lyndale Rd
- 307 Craftsman Ct
- 303 Craftsman Ct
- 64 Edgewood Rd
- 20 Dudley Rd
- 2754 Mansion Place
- 410-412 Orphanage Rd
- 566 Palmer Ct
- 568 Palmer Ct
- 564 Palmer Ct Unit C
- 570 Palmer Ct
- 562 Palmer Ct Unit 10B
- 560 Palmer Ct Unit 10A
- 550 Palmer Ct
- 548 Palmer Ct
- 546 Palmer Ct
- 2545 Champions Way
- 559 Palmer Ct
- 557 Palmer Ct Unit 4G
- 561 Palmer Ct Unit 4E
- 2543 Champions Way
- 563 Palmer Ct Unit 4D
- 565 Palmer Ct Unit 4C
- 544 Palmer Ct
- 2539 Champions Way Unit 3D
- 567 Palmer Ct
- 569 Palmer Ct