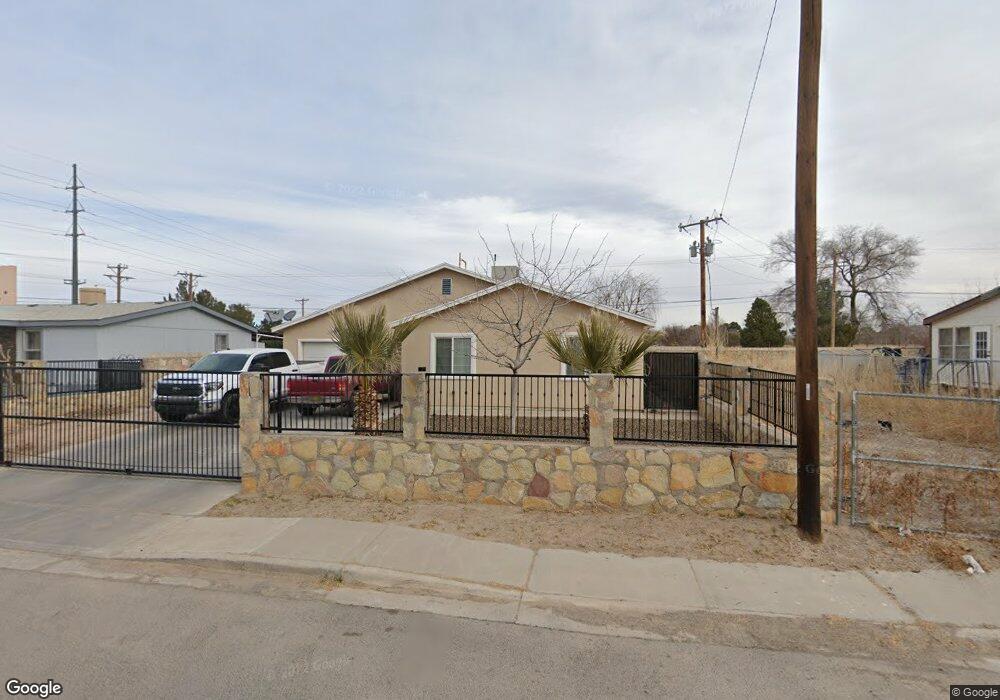
566 Putter Cir Anthony, NM 88021
Estimated Value: $200,000 - $223,871
3
Beds
2
Baths
1,236
Sq Ft
$171/Sq Ft
Est. Value
About This Home
This home is located at 566 Putter Cir, Anthony, NM 88021 and is currently estimated at $211,936, approximately $171 per square foot. 566 Putter Cir is a home with nearby schools including Gadsden Elementary School, Gadsden Middle School, and Gadsden High School.
Ownership History
Date
Name
Owned For
Owner Type
Purchase Details
Closed on
Nov 14, 2011
Sold by
Rubalcava Rebecca
Bought by
Parra Luis A and Campoya Claudia V
Current Estimated Value
Home Financials for this Owner
Home Financials are based on the most recent Mortgage that was taken out on this home.
Original Mortgage
$92,553
Outstanding Balance
$67,455
Interest Rate
3.99%
Mortgage Type
Purchase Money Mortgage
Estimated Equity
$144,481
Purchase Details
Closed on
Oct 22, 2008
Sold by
Lalloo Kishor and Lalloo Bharti
Bought by
Rubalcava Rebecca
Purchase Details
Closed on
May 18, 2002
Sold by
Evaro Eloisa C and Evaro Camilo
Bought by
Ruiz Jose Hector and Ruiz Hermalinda M
Purchase Details
Closed on
Apr 18, 2000
Sold by
Cordova Angel Y and Cordova Norma R
Bought by
Lalloo Kishor and Lalloo Bharti
Home Financials for this Owner
Home Financials are based on the most recent Mortgage that was taken out on this home.
Original Mortgage
$23,450
Interest Rate
11.5%
Mortgage Type
Seller Take Back
Create a Home Valuation Report for This Property
The Home Valuation Report is an in-depth analysis detailing your home's value as well as a comparison with similar homes in the area
Home Values in the Area
Average Home Value in this Area
Purchase History
| Date | Buyer | Sale Price | Title Company |
|---|---|---|---|
| Parra Luis A | -- | Southwestern Abstract & Titl | |
| Rubalcava Rebecca | -- | Swat | |
| Ruiz Jose Hector | -- | -- | |
| Lalloo Kishor | -- | Southwestern Abstract & Titl | |
| Cordova Angel Y | $25,950 | Southwestern Abstract & Titl |
Source: Public Records
Mortgage History
| Date | Status | Borrower | Loan Amount |
|---|---|---|---|
| Open | Parra Luis A | $92,553 | |
| Previous Owner | Cordova Angel Y | $23,450 |
Source: Public Records
Tax History Compared to Growth
Tax History
| Year | Tax Paid | Tax Assessment Tax Assessment Total Assessment is a certain percentage of the fair market value that is determined by local assessors to be the total taxable value of land and additions on the property. | Land | Improvement |
|---|---|---|---|---|
| 2024 | $1,824 | $51,247 | $9,944 | $41,303 |
| 2023 | $1,859 | $49,755 | $9,927 | $39,828 |
| 2022 | $2,016 | $48,306 | $9,849 | $38,457 |
| 2021 | $1,536 | $46,900 | $9,774 | $37,126 |
| 2020 | $1,531 | $46,900 | $9,774 | $37,126 |
| 2019 | $1,552 | $46,900 | $9,774 | $37,126 |
| 2018 | $1,429 | $46,900 | $9,774 | $37,126 |
| 2017 | $1,361 | $45,533 | $9,700 | $35,833 |
| 2016 | $1,379 | $45,533 | $9,700 | $35,833 |
| 2015 | $1,386 | $136,600 | $29,100 | $107,500 |
| 2014 | $1,386 | $136,600 | $29,100 | $107,500 |
Source: Public Records
Map
Nearby Homes
- 481 Tierra de Suenos
- 1310 N 4th St
- 1103 Jaime J Zapata St
- 1713 Acosta Rd
- 721 N 2nd St
- 401 Miller St
- 510 Anthony Dr
- 1620 E Ohara Rd
- 190 Whispering Dove Rd
- 991 Hill St
- 1153 Marquitos Ave
- 1151 Marquitos Ave
- 1780 Venadito Trail
- 1230 Lincoln St
- 451 Lipps Rd
- 1376 Lincoln St
- 1145 Boundary St
- 1400 Lincoln St
- 1141 Boundary St
- 416 5th St
- 570 Putter Cir
- 558 Putter Cir
- 574 Putter Cir
- 565 Putter Cir
- 1202 Onate St
- 569 Putter Cir
- 557 Putter Cir
- 554 Putter Cir
- 573 Putter Cir
- 553 Putter Cir
- 1206 Onate St
- 509 Putter Cir
- 505 Putter Cir
- 517 Putter Cir
- 501 Putter Cir
- 521 Putter Cir
- 1210 Onate St
- 533 Putter Cir
- lot 18 Putter Cir
- Lot 12 Putter Cir