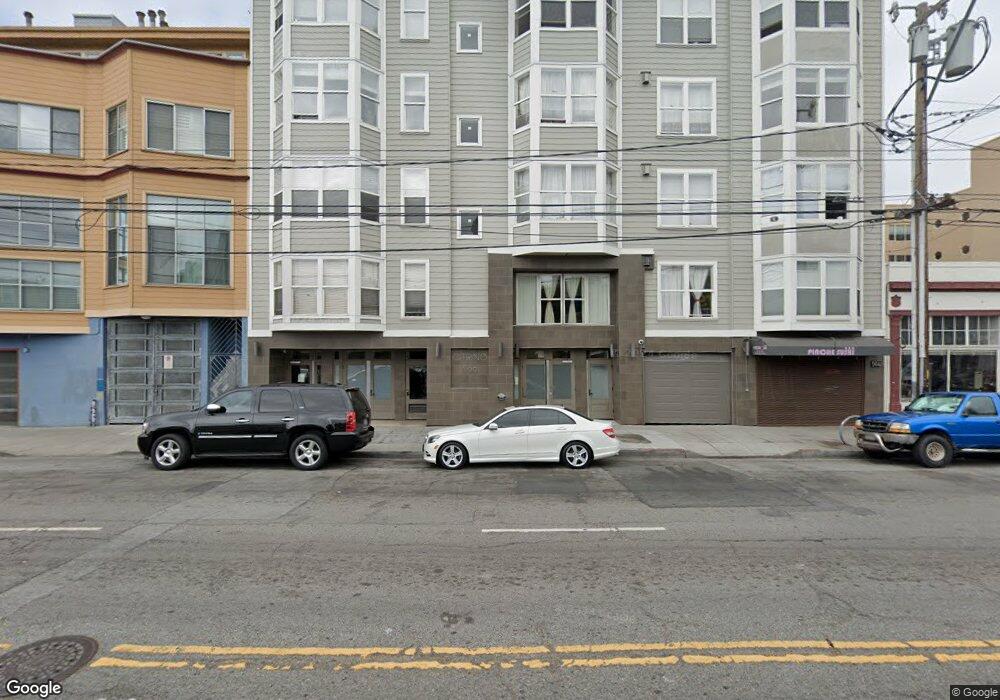
566 S Van Ness Ave Unit 25 San Francisco, CA 94110
Inner Mission NeighborhoodEstimated Value: $877,687 - $956,000
2
Beds
2
Baths
963
Sq Ft
$967/Sq Ft
Est. Value
About This Home
This home is located at 566 S Van Ness Ave Unit 25, San Francisco, CA 94110 and is currently estimated at $930,922, approximately $966 per square foot. 566 S Van Ness Ave Unit 25 is a home located in San Francisco County with nearby schools including George Moscone Elementary, Hoover (Herbert) Middle School, and Sacred Heart Cathedral Preparatory.
Ownership History
Date
Name
Owned For
Owner Type
Purchase Details
Closed on
Apr 29, 2015
Sold by
Wolf Jennifer H
Bought by
Kumar Anil B and Desai Tanvi
Current Estimated Value
Home Financials for this Owner
Home Financials are based on the most recent Mortgage that was taken out on this home.
Original Mortgage
$768,000
Outstanding Balance
$582,268
Interest Rate
3.25%
Mortgage Type
Adjustable Rate Mortgage/ARM
Estimated Equity
$348,654
Purchase Details
Closed on
Sep 26, 2007
Sold by
Everson Edward F
Bought by
Wolf Jennifer H
Home Financials for this Owner
Home Financials are based on the most recent Mortgage that was taken out on this home.
Original Mortgage
$591,200
Interest Rate
6.37%
Mortgage Type
Purchase Money Mortgage
Purchase Details
Closed on
Sep 14, 2007
Sold by
T & T Investments Llc
Bought by
Wolf Jennifer H
Home Financials for this Owner
Home Financials are based on the most recent Mortgage that was taken out on this home.
Original Mortgage
$591,200
Interest Rate
6.37%
Mortgage Type
Purchase Money Mortgage
Purchase Details
Closed on
Jul 21, 2004
Sold by
Severino Rose
Bought by
Severino Rose
Create a Home Valuation Report for This Property
The Home Valuation Report is an in-depth analysis detailing your home's value as well as a comparison with similar homes in the area
Home Values in the Area
Average Home Value in this Area
Purchase History
| Date | Buyer | Sale Price | Title Company |
|---|---|---|---|
| Kumar Anil B | $960,000 | Chicago Title Company | |
| Wolf Jennifer H | -- | First American Title Co | |
| Wolf Jennifer H | $739,000 | First American Title Co | |
| Severino Rose | -- | Old Republic Title Company |
Source: Public Records
Mortgage History
| Date | Status | Borrower | Loan Amount |
|---|---|---|---|
| Open | Kumar Anil B | $768,000 | |
| Previous Owner | Wolf Jennifer H | $591,200 |
Source: Public Records
Tax History Compared to Growth
Tax History
| Year | Tax Paid | Tax Assessment Tax Assessment Total Assessment is a certain percentage of the fair market value that is determined by local assessors to be the total taxable value of land and additions on the property. | Land | Improvement |
|---|---|---|---|---|
| 2025 | $14,075 | $1,153,760 | $576,880 | $576,880 |
| 2024 | $14,075 | $1,131,140 | $565,570 | $565,570 |
| 2023 | $13,846 | $1,108,964 | $554,482 | $554,482 |
| 2022 | $13,576 | $1,087,220 | $543,610 | $543,610 |
| 2021 | $13,335 | $1,065,904 | $532,952 | $532,952 |
| 2020 | $13,451 | $1,054,976 | $527,488 | $527,488 |
| 2019 | $12,943 | $1,034,292 | $517,146 | $517,146 |
| 2018 | $12,508 | $1,014,012 | $507,006 | $507,006 |
| 2017 | $12,063 | $994,132 | $497,066 | $497,066 |
| 2016 | $11,862 | $974,640 | $487,320 | $487,320 |
| 2015 | $9,831 | $807,658 | $524,597 | $283,061 |
| 2014 | $9,572 | $791,838 | $514,321 | $277,517 |
Source: Public Records
Map
Nearby Homes
- 550 S Van Ness Ave Unit 207
- 684 S Van Ness Ave
- 473 S Van Ness Ave
- 88 Hoff St Unit 101
- 88 Hoff St Unit 108
- 173 Julian Ave
- 1875 Mission St Unit 109
- 1875 Mission St Unit 304
- 3310 19th St Unit 303
- 133 Lexington St Unit 1
- 150 San Carlos St Unit 150
- 150 San Carlos St Unit A
- 147 Albion St
- 2130 Harrison St Unit 10
- 3118 18th St Unit 6
- 233 14th St
- 31 Camp St Unit A
- 81 Lapidge St
- 26 Albion St
- 2360 Folsom St Unit A
- 566 S Van Ness Ave
- 566 S Van Ness Ave
- 566 S Van Ness Ave Unit 32
- 566 S Van Ness Ave Unit 30
- 566 S Van Ness Ave Unit 27
- 566 S Van Ness Ave Unit 24
- 566 S Van Ness Ave Unit 23
- 566 S Van Ness Ave Unit 22
- 566 S Van Ness Ave Unit 19
- 566 S Van Ness Ave Unit 14
- 566 S Van Ness Ave Unit 11
- 566 S Van Ness Ave Unit 10
- 566 S Van Ness Ave Unit 7
- 566 S Van Ness Ave Unit 6
- 566 S Van Ness Ave Unit 1
- 566 S Van Ness Ave Unit 29
- 566 S Van Ness Ave Unit 28
- 566 S Van Ness Ave Unit 26
- 566 S Van Ness Ave Unit 21
- 566 S Van Ness Ave Unit 20