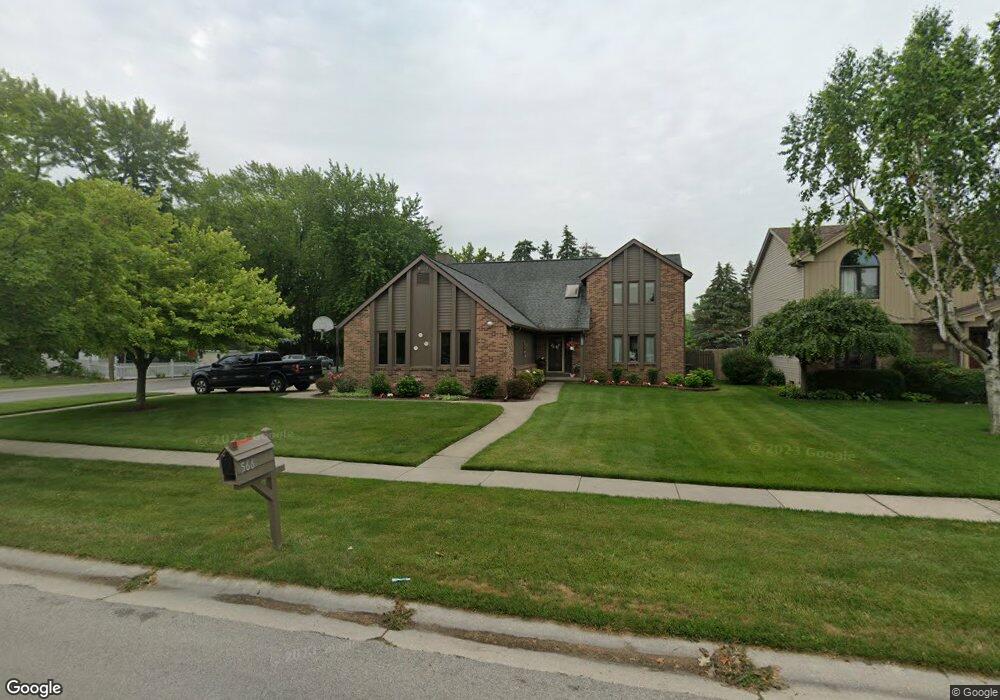
566 Thackeray Rd Maumee, OH 43537
Estimated Value: $316,743 - $351,000
3
Beds
4
Baths
2,222
Sq Ft
$151/Sq Ft
Est. Value
About This Home
This home is located at 566 Thackeray Rd, Maumee, OH 43537 and is currently estimated at $335,936, approximately $151 per square foot. 566 Thackeray Rd is a home located in Lucas County with nearby schools including Fairfield Elementary School, Maumee Intermediate School, and Maumee Middle School.
Ownership History
Date
Name
Owned For
Owner Type
Purchase Details
Closed on
Dec 14, 2004
Sold by
Cercek Dds John D and Cercek Melanie B
Bought by
Osgood Frank Kirk and Osgood Cynthia M
Current Estimated Value
Home Financials for this Owner
Home Financials are based on the most recent Mortgage that was taken out on this home.
Original Mortgage
$189,360
Outstanding Balance
$92,777
Interest Rate
5.82%
Mortgage Type
Purchase Money Mortgage
Estimated Equity
$243,159
Purchase Details
Closed on
May 2, 1998
Sold by
Cercek John D Dds and Cercek Melanie B
Bought by
Cercek Dds John D and Cercek Melanie B
Purchase Details
Closed on
Oct 13, 1992
Sold by
Nelson Paul J and Nelson Lori A
Purchase Details
Closed on
May 4, 1990
Sold by
Morrison Donald J
Purchase Details
Closed on
Aug 19, 1988
Sold by
Miller-Schulz Custom
Create a Home Valuation Report for This Property
The Home Valuation Report is an in-depth analysis detailing your home's value as well as a comparison with similar homes in the area
Home Values in the Area
Average Home Value in this Area
Purchase History
| Date | Buyer | Sale Price | Title Company |
|---|---|---|---|
| Osgood Frank Kirk | $236,700 | Louisville Title Agency For | |
| Cercek Dds John D | -- | -- | |
| -- | $167,500 | -- | |
| -- | $137,500 | -- | |
| -- | $135,800 | -- |
Source: Public Records
Mortgage History
| Date | Status | Borrower | Loan Amount |
|---|---|---|---|
| Open | Osgood Frank Kirk | $189,360 |
Source: Public Records
Tax History
| Year | Tax Paid | Tax Assessment Tax Assessment Total Assessment is a certain percentage of the fair market value that is determined by local assessors to be the total taxable value of land and additions on the property. | Land | Improvement |
|---|---|---|---|---|
| 2025 | -- | $95,375 | $15,785 | $79,590 |
| 2024 | $2,942 | $98,840 | $15,785 | $83,055 |
| 2023 | $5,879 | $85,330 | $15,365 | $69,965 |
| 2022 | $5,825 | $85,330 | $15,365 | $69,965 |
| 2021 | $6,142 | $85,330 | $15,365 | $69,965 |
| 2020 | $5,755 | $71,680 | $12,705 | $58,975 |
| 2019 | $5,613 | $71,680 | $12,705 | $58,975 |
| 2018 | $5,173 | $71,680 | $12,705 | $58,975 |
| 2017 | $4,830 | $61,040 | $14,280 | $46,760 |
| 2016 | $4,777 | $174,400 | $40,800 | $133,600 |
| 2015 | $4,754 | $174,400 | $40,800 | $133,600 |
| 2014 | $4,386 | $59,850 | $14,000 | $45,850 |
| 2013 | $4,386 | $59,850 | $14,000 | $45,850 |
Source: Public Records
Map
Nearby Homes
- 632 Brahier Ln
- 357 Wrexham Ln
- 1409 Bradshaw Ct
- 1269 Westfield Dr
- 4237 Brogan Dr
- 324 Oxford Ct
- 1371 Junior Dr
- 1313 Birch Ave
- 99 N Masters Ct
- 2147 Glen Arbor Dr
- 2053 Heatherwood Dr
- 1033 Anderson Ave
- 1004 Birch Ave
- 1936 W Crest Dr
- 1036 River Rd
- 1553 Heather Meadow Dr
- 224 Sackett St
- 706 Waite Ave
- 1014 Hugo St
- 5441 Cresthaven Ln
- 560 Thackeray Rd
- 4559 Thackeray Rd
- 556 Thackeray Rd
- 557 Mcintyre Ln
- 553 Mcintyre Ln
- 2202 Willowtree Ln
- 4553 Thackeray Rd
- 601 Mcintyre Ln
- 552 Thackeray Rd
- 549 Mcintyre Ln
- 547 Thackeray Rd
- 4547 Thackeray Rd
- 2206 Willowtree Ln
- 4560 Thackeray Rd
- 605 Mcintyre Ln
- 548 Thackeray Rd
- 545 Mcintyre Ln
- 4554 Thackeray Rd
- 2207 Willowtree Ln
- 4543 Thackeray Rd
Your Personal Tour Guide
Ask me questions while you tour the home.