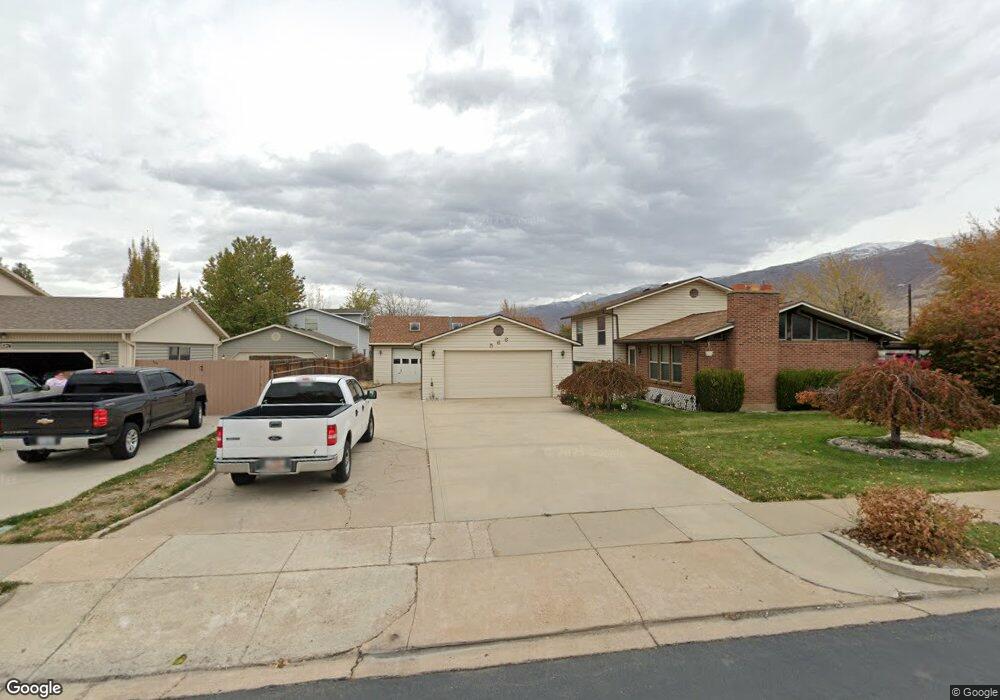
566 W 1810 N West Bountiful, UT 84087
Estimated Value: $453,538 - $539,000
3
Beds
1
Bath
1,216
Sq Ft
$410/Sq Ft
Est. Value
About This Home
This home is located at 566 W 1810 N, West Bountiful, UT 84087 and is currently estimated at $498,135, approximately $409 per square foot. 566 W 1810 N is a home located in Davis County with nearby schools including West Bountiful Elementary School, Bountiful Junior High School, and Viewmont High School.
Ownership History
Date
Name
Owned For
Owner Type
Purchase Details
Closed on
Jun 23, 2016
Sold by
Harrison Deanna D
Bought by
Harrison Deanna Dee and Harrison Trust
Current Estimated Value
Purchase Details
Closed on
Jun 7, 2004
Sold by
Harrison Del Rey Blaine and Harrison Dean Na D
Bought by
Harrison Del Rey Blaine and Harrison Deanna D
Home Financials for this Owner
Home Financials are based on the most recent Mortgage that was taken out on this home.
Original Mortgage
$23,900
Interest Rate
5.99%
Mortgage Type
Credit Line Revolving
Create a Home Valuation Report for This Property
The Home Valuation Report is an in-depth analysis detailing your home's value as well as a comparison with similar homes in the area
Home Values in the Area
Average Home Value in this Area
Purchase History
| Date | Buyer | Sale Price | Title Company |
|---|---|---|---|
| Harrison Deanna Dee | -- | -- | |
| Harrison Deanna D | -- | -- | |
| Harrison Del Rey Blaine | -- | Inwest Title Services Inc |
Source: Public Records
Mortgage History
| Date | Status | Borrower | Loan Amount |
|---|---|---|---|
| Previous Owner | Harrison Del Rey Blaine | $23,900 |
Source: Public Records
Tax History Compared to Growth
Tax History
| Year | Tax Paid | Tax Assessment Tax Assessment Total Assessment is a certain percentage of the fair market value that is determined by local assessors to be the total taxable value of land and additions on the property. | Land | Improvement |
|---|---|---|---|---|
| 2025 | $2,694 | $233,200 | $130,834 | $102,366 |
| 2024 | $328 | $223,850 | $107,528 | $116,322 |
| 2023 | $2,437 | $397,000 | $203,846 | $193,154 |
| 2022 | $2,449 | $223,300 | $97,435 | $125,865 |
| 2021 | $444 | $314,000 | $130,816 | $183,184 |
| 2020 | $1,996 | $276,000 | $121,870 | $154,130 |
| 2019 | $1,956 | $268,000 | $123,357 | $144,643 |
| 2018 | $1,836 | $248,000 | $124,142 | $123,858 |
| 2016 | $230 | $113,905 | $31,967 | $81,938 |
| 2015 | $1,473 | $102,630 | $31,967 | $70,663 |
| 2014 | $139 | $106,839 | $31,967 | $74,872 |
| 2013 | -- | $101,477 | $28,490 | $72,987 |
Source: Public Records
Map
Nearby Homes
- 637 W 1600 N
- 548 S 675 W
- 239 Lyman Ln
- Lincoln Farmhouse Plan at Belmont Farms
- Belmont Traditional Plan at Belmont Farms
- Hampton Traditional Plan at Belmont Farms
- 234 Leah Cir
- 668 W 2300 N
- 324 S 600 W
- 1552 N 200 W
- 2257 N 830 W
- 235 W 1400 N
- 1410 N 200 W
- 1536 N 150 W
- 825 W 1320 N
- 951 Centerville Commons Way
- 366 W 1000 N
- 1260 N 200 W
- 1194 N 200 W
- 2 S 285 W