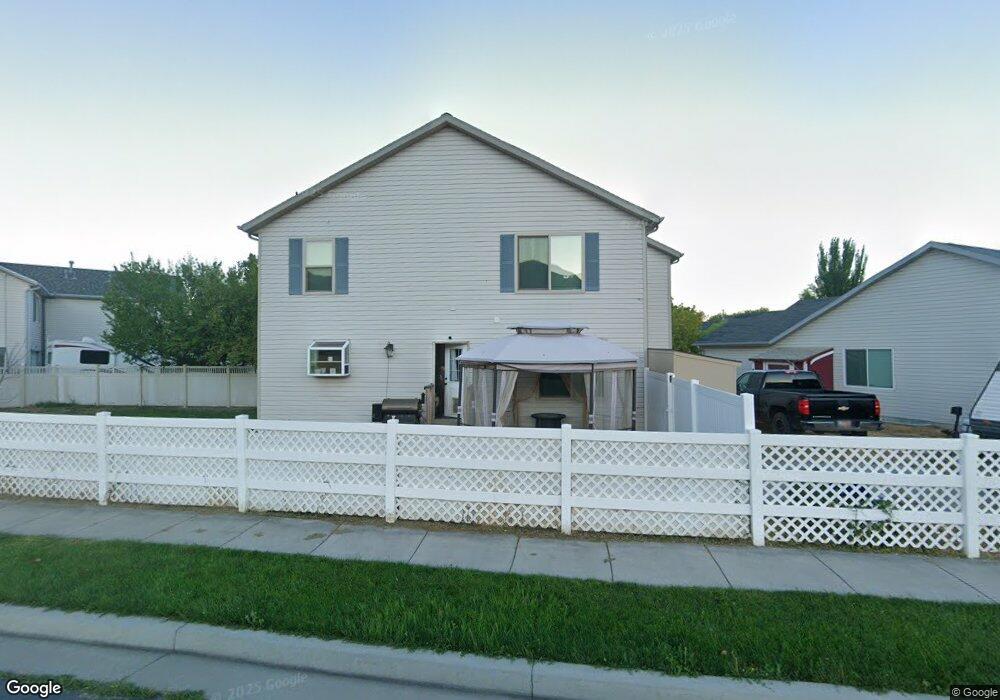
566 Wheatridge Rd Tooele, UT 84074
Estimated Value: $444,000 - $511,000
4
Beds
3
Baths
2,044
Sq Ft
$232/Sq Ft
Est. Value
About This Home
This home is located at 566 Wheatridge Rd, Tooele, UT 84074 and is currently estimated at $473,637, approximately $231 per square foot. 566 Wheatridge Rd is a home located in Tooele County with nearby schools including Stansbury Park Elementary School, Clarke N. Johnsen Junior High School, and Stansbury High School.
Ownership History
Date
Name
Owned For
Owner Type
Purchase Details
Closed on
May 16, 2022
Sold by
James Jones
Bought by
Letsinger Steven and Herrera Makinley
Current Estimated Value
Home Financials for this Owner
Home Financials are based on the most recent Mortgage that was taken out on this home.
Original Mortgage
$376,000
Outstanding Balance
$357,351
Interest Rate
5.3%
Mortgage Type
New Conventional
Estimated Equity
$116,286
Purchase Details
Closed on
Mar 8, 2019
Sold by
Jones James
Bought by
Jones James and Jones Kelley Ann
Home Financials for this Owner
Home Financials are based on the most recent Mortgage that was taken out on this home.
Original Mortgage
$15,700
Interest Rate
4.4%
Mortgage Type
Stand Alone Second
Purchase Details
Closed on
Mar 7, 2019
Sold by
Lang Rex W and Lang Deneene
Bought by
Jones James
Home Financials for this Owner
Home Financials are based on the most recent Mortgage that was taken out on this home.
Original Mortgage
$15,700
Interest Rate
4.4%
Mortgage Type
Stand Alone Second
Create a Home Valuation Report for This Property
The Home Valuation Report is an in-depth analysis detailing your home's value as well as a comparison with similar homes in the area
Home Values in the Area
Average Home Value in this Area
Purchase History
| Date | Buyer | Sale Price | Title Company |
|---|---|---|---|
| Letsinger Steven | -- | None Listed On Document | |
| Jones James | -- | Novation Title Ins Agcy | |
| Jones James | -- | Inwest Title Svcs Salt Lake |
Source: Public Records
Mortgage History
| Date | Status | Borrower | Loan Amount |
|---|---|---|---|
| Open | Letsinger Steven | $376,000 | |
| Previous Owner | Jones James | $15,700 |
Source: Public Records
Tax History Compared to Growth
Tax History
| Year | Tax Paid | Tax Assessment Tax Assessment Total Assessment is a certain percentage of the fair market value that is determined by local assessors to be the total taxable value of land and additions on the property. | Land | Improvement |
|---|---|---|---|---|
| 2025 | $3,297 | $416,738 | $138,000 | $278,738 |
| 2024 | $3,710 | $238,336 | $75,900 | $162,436 |
| 2023 | $3,710 | $240,112 | $79,200 | $160,912 |
| 2022 | $2,811 | $225,548 | $66,990 | $158,558 |
| 2021 | $2,551 | $169,058 | $56,678 | $112,380 |
| 2020 | $2,419 | $280,337 | $75,700 | $204,637 |
| 2019 | $2,340 | $266,762 | $75,700 | $191,062 |
| 2018 | $1,906 | $208,137 | $25,000 | $183,137 |
| 2017 | $1,726 | $199,416 | $25,000 | $174,416 |
| 2016 | $1,473 | $97,166 | $13,750 | $83,416 |
| 2015 | $1,473 | $92,445 | $0 | $0 |
| 2014 | -- | $92,445 | $0 | $0 |
Source: Public Records
Map
Nearby Homes
- 42 Millpond
- 641 Hal St
- 6264 Cam Ct
- 497 Frost Ln
- 361 E Vancott Way
- 6842 Bigelow Dr
- 153 Country Club Dr
- 6628 Malachite Way
- 283 E Rockwood Way
- 33 E Delgada Ln
- 6545 N Valley Point Way
- 209 Country Club Dr
- 789 Country Club Dr
- 173 Lakeview Dr
- 6496 Spur Ln N Unit 1219
- 5742 N Gray Hawk Dr
- 6488 N Spur Ln
- 6508 N Spur Ln Unit 1220
- 6508 N Spur Ln
- 6445 Black Ridge Dr
- 565 Wheatridge Rd
- 564 Wheatridge Rd
- 562 Water Wheel Ln
- 556 Wheatridge Rd
- 551 Wheatridge Rd
- 552 Water Wheel Ln
- 546 Wheatridge Rd
- 539 Wheatridge Rd
- 538 Wheatridge Rd
- 546 Water Wheel Ln
- 563 Water Wheel Ln
- 109 Crystal Bay Dr
- 553 Water Wheel Ln
- 113 Crystal Bay Dr
- 107 Crystal Bay Dr
- 107 Crystal Bay Dr Unit 17
- 538 Water Wheel Ln
- 115 Crystal Bay Dr
- 543 Water Wheel Ln
- 117 Crystal Bay Dr