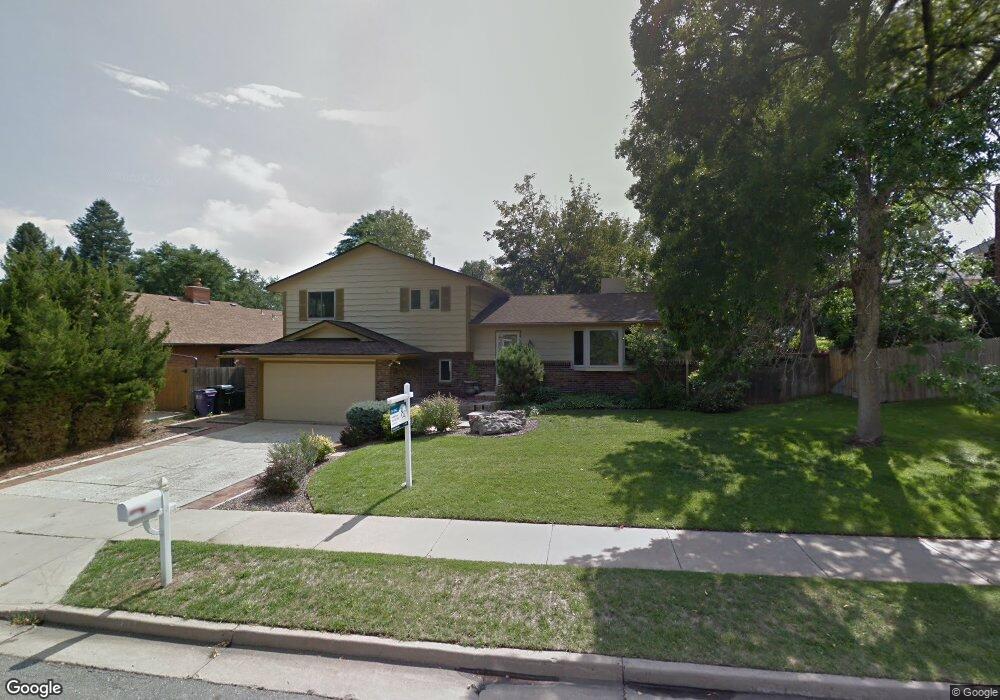
5660 W Lehigh Ave Denver, CO 80235
Fort Logan NeighborhoodEstimated Value: $624,000 - $715,000
3
Beds
4
Baths
2,568
Sq Ft
$262/Sq Ft
Est. Value
About This Home
This home is located at 5660 W Lehigh Ave, Denver, CO 80235 and is currently estimated at $671,881, approximately $261 per square foot. 5660 W Lehigh Ave is a home located in Denver County with nearby schools including Sabin World School, Bear Valley International School, and John F Kennedy High School.
Ownership History
Date
Name
Owned For
Owner Type
Purchase Details
Closed on
Feb 11, 2020
Sold by
Jason Sanfilippo
Bought by
Allen Kaufman Jay and Joyce Brenda Joyce
Current Estimated Value
Purchase Details
Closed on
Sep 30, 2014
Sold by
Lynge Jeffrey J
Bought by
Sanfilippo Jason
Home Financials for this Owner
Home Financials are based on the most recent Mortgage that was taken out on this home.
Original Mortgage
$323,000
Interest Rate
4.12%
Mortgage Type
New Conventional
Purchase Details
Closed on
Jul 3, 2014
Sold by
Asimos Lynge Darci
Bought by
Lynge Jeffrey J
Purchase Details
Closed on
Apr 6, 1998
Sold by
Lynge Jeffrey J and Lynge Scott T
Bought by
Lynge Jeffrey J and Asimos Lynge Darci
Purchase Details
Closed on
May 26, 1994
Sold by
Jensen Kopec Nadee and Kopec Thomas R
Bought by
Lynge Jeffrey J and Lynge Scott T
Home Financials for this Owner
Home Financials are based on the most recent Mortgage that was taken out on this home.
Original Mortgage
$156,650
Interest Rate
5.25%
Create a Home Valuation Report for This Property
The Home Valuation Report is an in-depth analysis detailing your home's value as well as a comparison with similar homes in the area
Home Values in the Area
Average Home Value in this Area
Purchase History
| Date | Buyer | Sale Price | Title Company |
|---|---|---|---|
| Allen Kaufman Jay | $450,000 | Chicago Title Co | |
| Sanfilippo Jason | $340,000 | Chicago Title | |
| Lynge Jeffrey J | -- | None Available | |
| Lynge Jeffrey J | -- | Stewart Title | |
| Lynge Jeffrey J | $164,900 | -- |
Source: Public Records
Mortgage History
| Date | Status | Borrower | Loan Amount |
|---|---|---|---|
| Previous Owner | Sanfilippo Jason | $323,000 | |
| Previous Owner | Lynge Jeffrey J | $156,650 |
Source: Public Records
Tax History Compared to Growth
Tax History
| Year | Tax Paid | Tax Assessment Tax Assessment Total Assessment is a certain percentage of the fair market value that is determined by local assessors to be the total taxable value of land and additions on the property. | Land | Improvement |
|---|---|---|---|---|
| 2024 | $3,319 | $41,900 | $3,300 | $38,600 |
| 2023 | $3,247 | $41,900 | $3,300 | $38,600 |
| 2022 | $2,661 | $33,460 | $7,240 | $26,220 |
| 2021 | $2,569 | $34,430 | $7,450 | $26,980 |
| 2020 | $2,450 | $33,020 | $6,830 | $26,190 |
| 2019 | $2,381 | $33,020 | $6,830 | $26,190 |
| 2018 | $2,172 | $28,070 | $6,250 | $21,820 |
| 2017 | $2,165 | $28,070 | $6,250 | $21,820 |
| 2016 | $2,178 | $26,710 | $6,225 | $20,485 |
| 2015 | $2,087 | $26,710 | $6,225 | $20,485 |
| 2014 | $1,585 | $19,080 | $4,776 | $14,304 |
Source: Public Records
Map
Nearby Homes
- 3792 S Fenton Way
- 3666 S Depew St Unit 301
- 3663 S Sheridan Blvd Unit A9
- 3663 S Sheridan Blvd Unit J12
- 3663 S Sheridan Blvd Unit 14
- 3656 S Depew St Unit 305
- 3656 S Depew St Unit 104
- 3558 S Depew St Unit 302
- 3586 S Depew St Unit 205
- 3586 S Depew St Unit 306
- 3811 S Ames St
- 3643 S Sheridan Blvd Unit 12
- 3701 S Harlan St
- 3623 S Sheridan Blvd Unit 11
- 3623 S Sheridan Blvd Unit 17
- 3623 S Sheridan Blvd Unit 14
- 3623 S Sheridan Blvd Unit 12
- 6055 W Keene Ave
- 3550 S Harlan St Unit 335
- 3550 S Harlan St Unit 214
- 5630 W Lehigh Ave
- 5690 W Lehigh Ave
- 3810 S Eaton St
- 5590 W Lehigh Ave
- 3816 S Eaton St
- 3790 S Eaton St
- 5635 W Lehigh Ave
- 5560 W Lehigh Ave
- 3825 S Chase St
- 3826 S Eaton St
- 3785 S Depew St
- 3829 S Chase St
- 3791 S Eaton St
- 3780 S Eaton St
- 3811 S Eaton St
- 5720 W Lehigh Ave
- 5595 W Lehigh Ave
- 3828 S Eaton St
- 3781 S Eaton St
- 5540 W Lehigh Ave