56600 Pinch Run Rd Bellaire, OH 43906
Estimated Value: $91,000 - $137,000
3
Beds
2
Baths
993
Sq Ft
$113/Sq Ft
Est. Value
About This Home
This home is located at 56600 Pinch Run Rd, Bellaire, OH 43906 and is currently estimated at $112,341, approximately $113 per square foot. 56600 Pinch Run Rd is a home located in Belmont County with nearby schools including Bellaire Elementary School, Bellaire Middle School, and Bellaire High School.
Ownership History
Date
Name
Owned For
Owner Type
Purchase Details
Closed on
Jan 3, 2019
Sold by
Grall Tony Lee and Grall Mildred Michelle
Bought by
Grall Austin
Current Estimated Value
Purchase Details
Closed on
Nov 6, 2012
Sold by
Hicks Joseph D
Bought by
Grall Tony Lee and Grall Mildred Michelle
Home Financials for this Owner
Home Financials are based on the most recent Mortgage that was taken out on this home.
Original Mortgage
$48,000
Outstanding Balance
$33,185
Interest Rate
3.4%
Mortgage Type
Seller Take Back
Estimated Equity
$79,156
Purchase Details
Closed on
Aug 4, 2008
Sold by
Muklewicz Beatrice
Bought by
Hicks Joseph D
Home Financials for this Owner
Home Financials are based on the most recent Mortgage that was taken out on this home.
Original Mortgage
$70,000
Interest Rate
6.5%
Mortgage Type
Purchase Money Mortgage
Purchase Details
Closed on
Jan 1, 1986
Sold by
Muklewicz Stanley
Bought by
Muklewicz Stanley
Create a Home Valuation Report for This Property
The Home Valuation Report is an in-depth analysis detailing your home's value as well as a comparison with similar homes in the area
Home Values in the Area
Average Home Value in this Area
Purchase History
| Date | Buyer | Sale Price | Title Company |
|---|---|---|---|
| Grall Austin | -- | None Available | |
| Grall Tony Lee | $50,000 | Attorney | |
| Hicks Joseph D | $80,000 | Attorney | |
| Muklewicz Stanley | -- | -- |
Source: Public Records
Mortgage History
| Date | Status | Borrower | Loan Amount |
|---|---|---|---|
| Open | Grall Tony Lee | $48,000 | |
| Closed | Hicks Joseph D | $70,000 |
Source: Public Records
Tax History Compared to Growth
Tax History
| Year | Tax Paid | Tax Assessment Tax Assessment Total Assessment is a certain percentage of the fair market value that is determined by local assessors to be the total taxable value of land and additions on the property. | Land | Improvement |
|---|---|---|---|---|
| 2024 | $1,017 | $27,810 | $5,900 | $21,910 |
| 2023 | $965 | $24,300 | $4,620 | $19,680 |
| 2022 | $966 | $24,297 | $4,620 | $19,677 |
| 2021 | $963 | $24,297 | $4,620 | $19,677 |
| 2020 | $878 | $21,130 | $4,020 | $17,110 |
| 2019 | $924 | $21,130 | $4,020 | $17,110 |
| 2018 | $776 | $21,130 | $4,020 | $17,110 |
| 2017 | $678 | $16,600 | $2,750 | $13,850 |
| 2016 | $681 | $16,600 | $2,750 | $13,850 |
| 2015 | $690 | $16,600 | $2,750 | $13,850 |
| 2014 | $601 | $13,850 | $2,500 | $11,350 |
| 2013 | $522 | $13,850 | $2,500 | $11,350 |
Source: Public Records
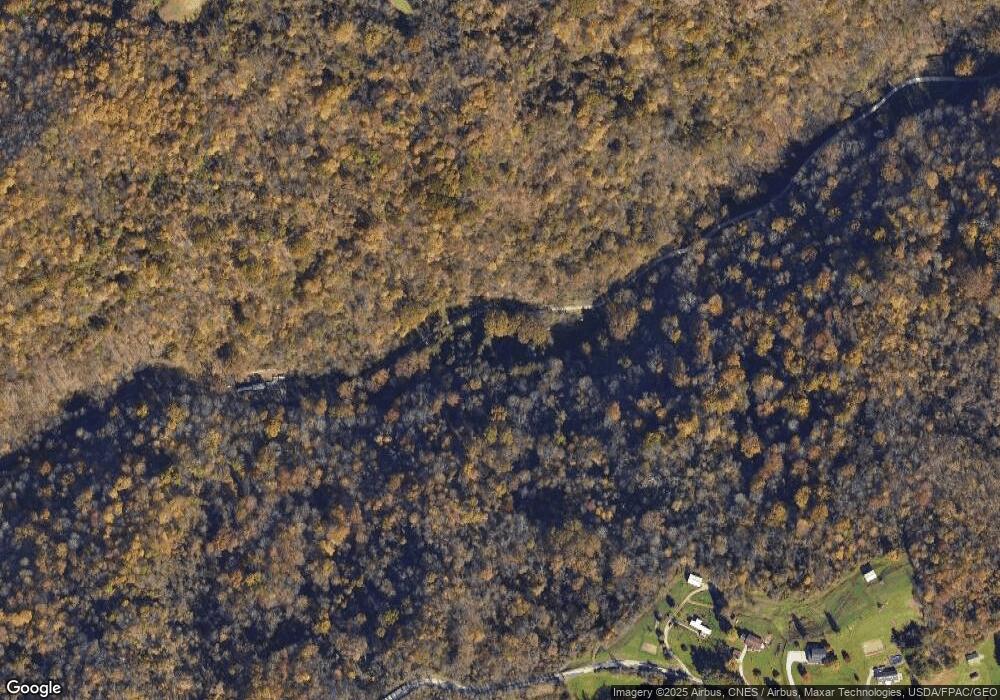
Map
Nearby Homes
- 525 W 39th St
- 56929 Winding Hill Rd
- 3927 Daisyview St
- 473 W 39th St
- 225 W 40th St
- 56068 Key Bellaire Rd
- 3971 Grandview Ave
- 3302 Central Ave
- 105 W 40th St
- 3480 Central Ave
- 3871 Central Ave
- 3450 Elk Ave
- 157 W 45th St
- 52 E 37th St
- 3970 Central Ave
- 135 W 45th St
- 2364 W 23rd St
- 3608 Lincoln Ave
- 55794 Bell Haven
- 3841 Grand Ave
- 56550 Pinch Run Rd
- 0 New Cut Rd
- 57059 New Cut Rd
- 56940 Pinch Run Rd
- 57075 New Cut Rd
- 57141 New Cut Rd
- 57040 Pinch Run Rd
- 57161 New Cut Rd
- 57200 New Cut Rd
- 57197 New Cut Rd
- 57299 New Cut Rd
- 57260 New Cut Rd
- 57261 New Cut Rd
- 46 County Road 46
- 57256 New Cut Rd
- 56310 Winding Hill Rd
- 57314 New Cut Rd
- 56280 Winding Hill Rd
- 57171 Pinch Run Rd
- 56471 New Cut Rd